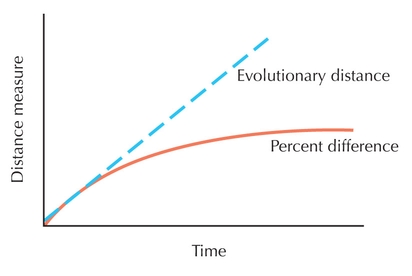
Figure 27.18. Distance corrections. If evolution occurs at a constant rate, then the percent difference between two OTUs should increase linearly with time (blue dashed line). However, this only applies if there are an infinite number of traits and states being compared. This does not occur with real data. For example, with DNA sequence data, there are only four possible states at any one character. This means that as two DNA sequences diverge, there is a limit to their maximum divergence. In addition, if multiple mutations occur at one site, the difference between the two DNA sequences will be less than the “evolutionary distance” between the organisms. The percent difference versus time will look something like the red solid line in this graph. For this reason, distance correction methods have been developed that allow the conversion of the solid line to the dashed line so that one can estimate the evolutionary distance from measures of percent difference.
| © 2007-2010 by Cold Spring Harbor Laboratory Press. All rights reserved. |
| The reproduction, modification, storage in a retrieval system, or retransmission, in any form or by any means, electronic, mechanical, or otherwise, for reasons other than personal, noncommercial use is strictly prohibited without prior written permission. You are authorized to download one copy of the material on this Web site for personal, noncommercial use only. The material made available on this Web site is protected by United States copyright laws and is provided solely for the use of instructors in teaching their courses and assessing student learning. Dissemination or sale of any of this material, as a whole or in parts (including on the World Wide Web), is not permitted. All users of these materials and visitors to this Web site are expected to abide by these restrictions. Requests for permission for other uses of this material should be directed to Cold Spring Harbor Laboratory Press, 1 Bungtown Road, Cold Spring Harbor, NY 11724 or submitted via our World Wide Web Site at http://www.cshlpress.com/. |