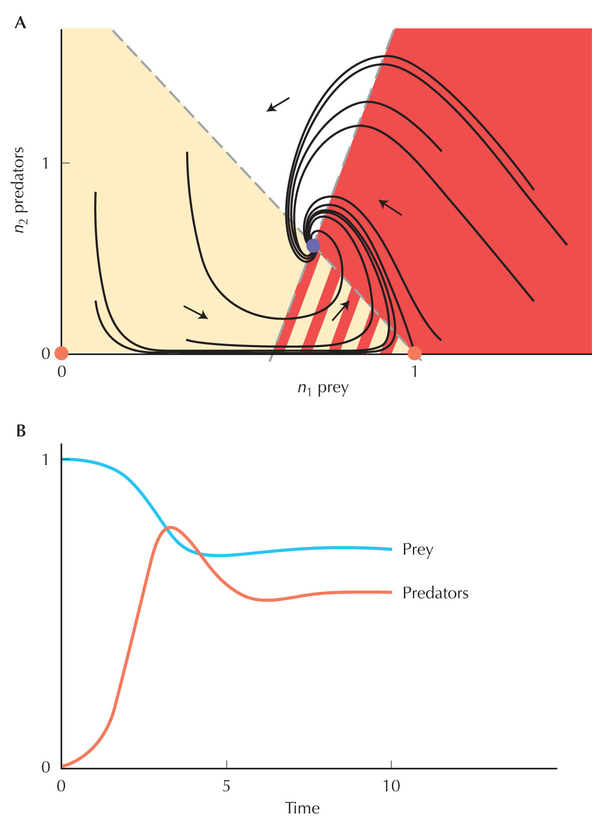
Figure WN28.2. Stable coexistence of prey with predators. (A) Effect of prey numbers on predator fitness is a = +5; of predator numbers on prey fitness is b = 0.5; and rate of decline of prey in the absence of predators is ρ = 3. (Short dashed line) Boundary between regions where prey density increases (below, yellow tint) and decreases (above). (Long dashed line) Boundary between regions where predators increase (right, red tint) and decrease (left). The curves show the trajectories followed by populations as they converge on the stable equilibrium (purple). There are also unstable equilibria (red) where both species are extinct (bottom left) or where just predators are extinct (bottom right). (B) Fluctuations of predator and prey abundance as predators invade prey and prey decline. These correspond to the trajectory in A that connects the unstable equilibrium at bottom right to the stable interior equilibrium.
| © 2007-2010 by Cold Spring Harbor Laboratory Press. All rights reserved. |
| The reproduction, modification, storage in a retrieval system, or retransmission, in any form or by any means, electronic, mechanical, or otherwise, for reasons other than personal, noncommercial use is strictly prohibited without prior written permission. You are authorized to download one copy of the material on this Web site for personal, noncommercial use only. The material made available on this Web site is protected by United States copyright laws and is provided solely for the use of instructors in teaching their courses and assessing student learning. Dissemination or sale of any of this material, as a whole or in parts (including on the World Wide Web), is not permitted. All users of these materials and visitors to this Web site are expected to abide by these restrictions. Requests for permission for other uses of this material should be directed to Cold Spring Harbor Laboratory Press, 1 Bungtown Road, Cold Spring Harbor, NY 11724 or submitted via our World Wide Web Site at http://www.cshlpress.com/. |