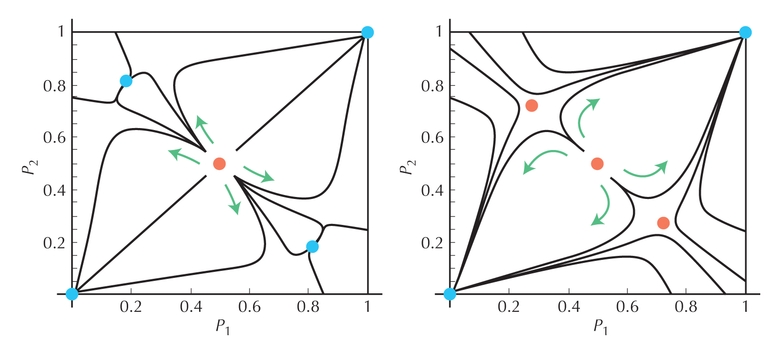
Figure P18.6. Evolution of a chromosomal arrangement in two demes, under gene flow and selection against heterozygotes. Allele frequencies in two demes (p1, p2) are plotted on the two axes, with the population starting at various points. (Red) Unstable equilibria; (blue) stable equilibria. The left panel is for M = m/s = 0.15. There are two stable equilibria with different arrangements common in different demes (top left, bottom right), separated by an unstable equilibrium at p1 = p2 = 1/2. The right panel is for a higher rate of gene flow (M = m/s = 0.2). Now, the two asymmetrical equilibria exist, but are unstable (red dots at top left, bottom right): One or the other arrangement will fix in both demes.
| © 2007-2010 by Cold Spring Harbor Laboratory Press. All rights reserved. |
| The reproduction, modification, storage in a retrieval system, or retransmission, in any form or by any means, electronic, mechanical, or otherwise, for reasons other than personal, noncommercial use is strictly prohibited without prior written permission. You are authorized to download one copy of the material on this Web site for personal, noncommercial use only. The material made available on this Web site is protected by United States copyright laws and is provided solely for the use of instructors in teaching their courses and assessing student learning. Dissemination or sale of any of this material, as a whole or in parts (including on the World Wide Web), is not permitted. All users of these materials and visitors to this Web site are expected to abide by these restrictions. Requests for permission for other uses of this material should be directed to Cold Spring Harbor Laboratory Press, 1 Bungtown Road, Cold Spring Harbor, NY 11724 or submitted via our World Wide Web Site at http://www.cshlpress.com/. |