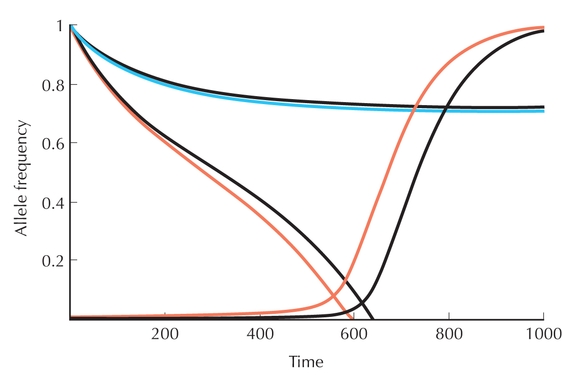
Figure P22.8. Timescale of change in the above example, with m = 0.002 (blue) or m = 0.0035 (red). For each migration rate, allele frequency pA is shown falling from 1, and pB increasing from 0. Thus, if m > 0.0025, the frequency of AP decreases under the pressure of migration and eventually becomes so rare that allele BP can increase: The population then fixes the opposite combination AQBP. (Black curves) Exact calculation, allowing for linkage disequilibrium: The discrepancy is not large, which justifies our approximation of ignoring linkage disequilibrium.
| © 2007-2010 by Cold Spring Harbor Laboratory Press. All rights reserved. |
| The reproduction, modification, storage in a retrieval system, or retransmission, in any form or by any means, electronic, mechanical, or otherwise, for reasons other than personal, noncommercial use is strictly prohibited without prior written permission. You are authorized to download one copy of the material on this Web site for personal, noncommercial use only. The material made available on this Web site is protected by United States copyright laws and is provided solely for the use of instructors in teaching their courses and assessing student learning. Dissemination or sale of any of this material, as a whole or in parts (including on the World Wide Web), is not permitted. All users of these materials and visitors to this Web site are expected to abide by these restrictions. Requests for permission for other uses of this material should be directed to Cold Spring Harbor Laboratory Press, 1 Bungtown Road, Cold Spring Harbor, NY 11724 or submitted via our World Wide Web Site at http://www.cshlpress.com/. |