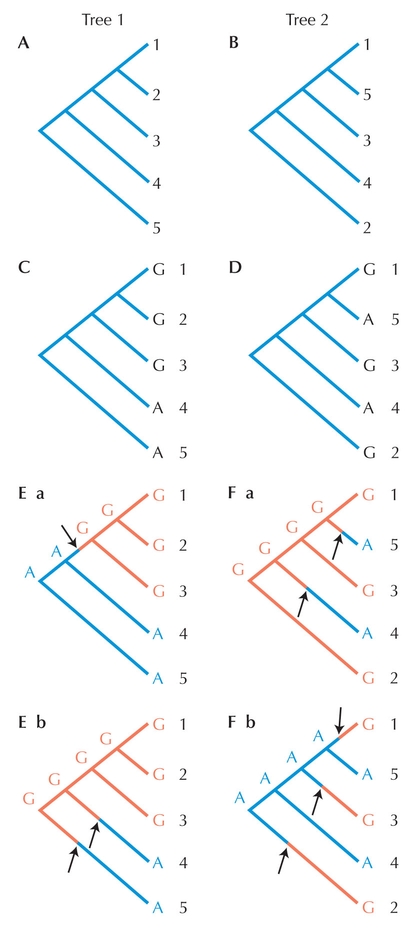
Figure 27.10. Parsimony analysis. Two possible trees relating the sequences from Fig. 27.9 are compared. (Left column) Possible tree #1; (right column) possible tree #2. (A,B) Two possible trees. (C,D) Character states from alignment column #1 are overlaid onto the trees. (E,F) Possible ancestral character state reconstructions are shown for each tree. Character states are indicated on the tree for ancestral nodes. State changes are indicated by arrows. For tree #1, one reconstruction (Ea) requires only one character state change, whereas the other (Eb) requires two. Thus for this tree we would infer that only one character state change is required to fit the data in alignment column 1 to the tree. For tree #2, on reconstruction requires two state changes (Fa), whereas the other requires three (Fb). Thus for this tree we would infer that two character state changes are required to fit the data in alignment column 1 to the tree. Since tree #1 only requires a single state change, this tree would be favored as more parsimonious over tree #2.
| © 2007-2010 by Cold Spring Harbor Laboratory Press. All rights reserved. |
| The reproduction, modification, storage in a retrieval system, or retransmission, in any form or by any means, electronic, mechanical, or otherwise, for reasons other than personal, noncommercial use is strictly prohibited without prior written permission. You are authorized to download one copy of the material on this Web site for personal, noncommercial use only. The material made available on this Web site is protected by United States copyright laws and is provided solely for the use of instructors in teaching their courses and assessing student learning. Dissemination or sale of any of this material, as a whole or in parts (including on the World Wide Web), is not permitted. All users of these materials and visitors to this Web site are expected to abide by these restrictions. Requests for permission for other uses of this material should be directed to Cold Spring Harbor Laboratory Press, 1 Bungtown Road, Cold Spring Harbor, NY 11724 or submitted via our World Wide Web Site at http://www.cshlpress.com/. |