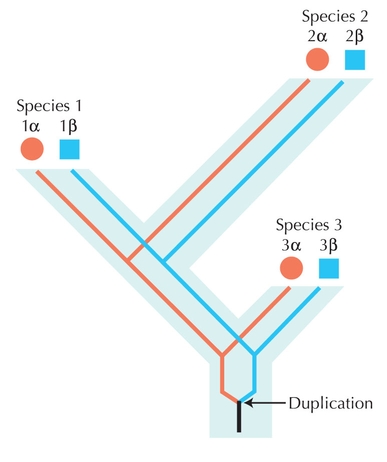
Figure 27.32. Sequence similarity does not always accurately represent relatedness. In this hypothetical tree, the evolution of three species is indicated by thick light blue bars and the evolution of specific genes is indicated by thin red and blue lines within the bars. An early gene duplication gave rise to the α and β genes; thus all of the α genes are paralogs of the β genes. Over time, the α and β genes diverged such that their functions now differ (indicated by red and blue). The multiple forms of the α genes arose through speciation events, and thus all are orthologs of each other (and likewise for all the β genes). If species 3 had a slower rate of evolution than the other two, then the α and β paralogs within species 3 will be more similar to each other (as measured by summing the branch lengths connecting them) than either is to their orthologs in other species. (Redrawn from Eisen J.A. Genome Res. 8: 163–167, Table 4, © 1998 CSHLP.)
| © 2007-2010 by Cold Spring Harbor Laboratory Press. All rights reserved. |
| The reproduction, modification, storage in a retrieval system, or retransmission, in any form or by any means, electronic, mechanical, or otherwise, for reasons other than personal, noncommercial use is strictly prohibited without prior written permission. You are authorized to download one copy of the material on this Web site for personal, noncommercial use only. The material made available on this Web site is protected by United States copyright laws and is provided solely for the use of instructors in teaching their courses and assessing student learning. Dissemination or sale of any of this material, as a whole or in parts (including on the World Wide Web), is not permitted. All users of these materials and visitors to this Web site are expected to abide by these restrictions. Requests for permission for other uses of this material should be directed to Cold Spring Harbor Laboratory Press, 1 Bungtown Road, Cold Spring Harbor, NY 11724 or submitted via our World Wide Web Site at http://www.cshlpress.com/. |