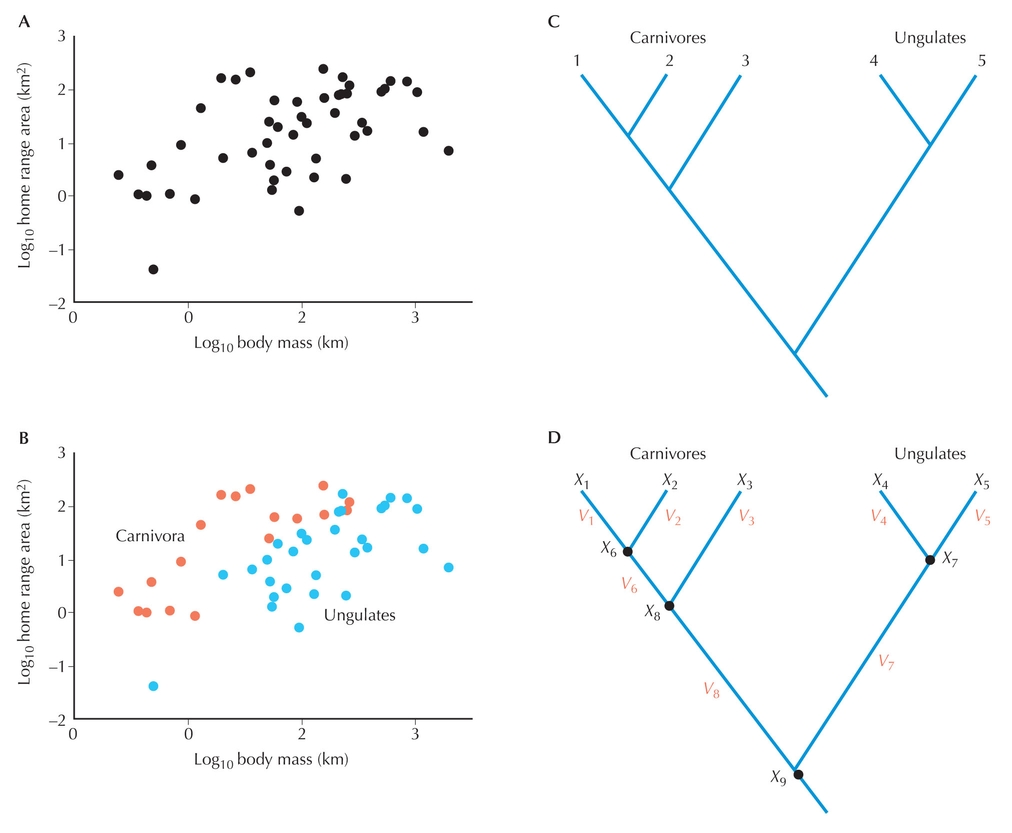
Figure 27.36. (A) Home range areas of 49 species of mammals in relation to their body size. Larger-bodied species tend to have larger home ranges. (B) When the phylogeny of the organisms is included in the analysis, it becomes clear that there are stronger positive correlations within each group (carnivores and ungulates) than when considered all together. The method of phylogenetic contrasts attempts to calculate correlations between variables in which phylogeny of the organisms is considered. It does this by calculating how the variables change along a tree of the organisms and then examining what the correlations are in the patterns of change (e.g., if as body size increases, does home range increase). (C) A hypothetical tree showing five of the species in A and B. (D) Calculating contrasts for the tree in C for variable X (e.g., body mass). First, the values for variable X are overlaid onto the tips of the tree (X1 – X5) for each species. Then contrasts are calculated for this variable along the tree. For example X1 – X2 is a contrast for the clade of species 1 and 2. X3 – X6 is the contrast for species 3 versus the ancestor of species 1 and 2. X6 represents an inferred character state for the variable X for this ancestor. All other contrasts are calculated for the tree (e.g., X4 – X5). Then the contrasts are calculated for another variable Y (e.g., home range). The corresponding contrasts are then compared (e.g., X1 – X2 vs. Y1 – Y2) to each other, allowing one to determine if there are relationships in how these variables change along the tree. (A, Modified from Garland T. Jr. et al. Syst. Biol. 42: 265–292, Fig. 2, © 1993 American Institute of Biological Sciences. B, Redrawn from Garland T. Jr. et al. Syst. Biol. 42: 265–292, Fig. 2, © 1993 American Institute of Biological Sciences. C, Modified from McPeek M.A. Am. Naturalist 145: 686–703, Fig 1 © 1995 University of Chicago Press. D, Redrawn from McPeek M.A. Am. Naturalist 145: 686–703, Fig. 1, © 1995 University of Chicago Press.)
| © 2007-2010 by Cold Spring Harbor Laboratory Press. All rights reserved. |
| The reproduction, modification, storage in a retrieval system, or retransmission, in any form or by any means, electronic, mechanical, or otherwise, for reasons other than personal, noncommercial use is strictly prohibited without prior written permission. You are authorized to download one copy of the material on this Web site for personal, noncommercial use only. The material made available on this Web site is protected by United States copyright laws and is provided solely for the use of instructors in teaching their courses and assessing student learning. Dissemination or sale of any of this material, as a whole or in parts (including on the World Wide Web), is not permitted. All users of these materials and visitors to this Web site are expected to abide by these restrictions. Requests for permission for other uses of this material should be directed to Cold Spring Harbor Laboratory Press, 1 Bungtown Road, Cold Spring Harbor, NY 11724 or submitted via our World Wide Web Site at http://www.cshlpress.com/. |