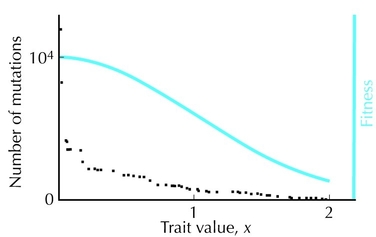
Figure 28.11. Adaptive dynamics is a method for analyzing evolutionary models. This example represents the evolution of an asexual population, which varies in some continuous trait x. At low density, individuals have highest fitness if they are close to x = 0 (blue curve). Initially, the population consists of poorly adapted individuals with trait value x = 2 (bottom right). New alleles are introduced by mutation and differ slightly from the resident type. They can invade if they bring the phenotype closer to the optimum at x = 0. The black dots show how each successive mutation brings the phenotype closer to the optimum. Because mutations are assumed to be similar to the resident population and to substitute one by one, adaptation is slow: This diagram shows the outcome of more than 104 trial mutations.
| © 2007-2010 by Cold Spring Harbor Laboratory Press. All rights reserved. |
| The reproduction, modification, storage in a retrieval system, or retransmission, in any form or by any means, electronic, mechanical, or otherwise, for reasons other than personal, noncommercial use is strictly prohibited without prior written permission. You are authorized to download one copy of the material on this Web site for personal, noncommercial use only. The material made available on this Web site is protected by United States copyright laws and is provided solely for the use of instructors in teaching their courses and assessing student learning. Dissemination or sale of any of this material, as a whole or in parts (including on the World Wide Web), is not permitted. All users of these materials and visitors to this Web site are expected to abide by these restrictions. Requests for permission for other uses of this material should be directed to Cold Spring Harbor Laboratory Press, 1 Bungtown Road, Cold Spring Harbor, NY 11724 or submitted via our World Wide Web Site at http://www.cshlpress.com/. |