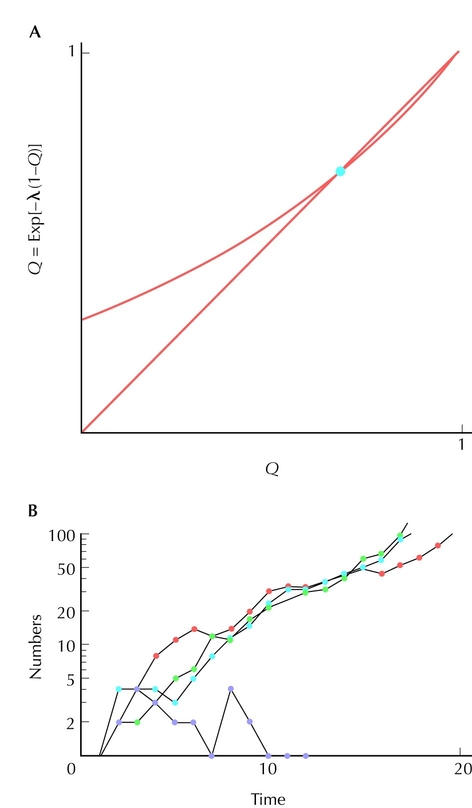
Figure 28.22. (A) The probability of ultimate extinction can be found graphically. The diagonal line plots Q, and the curve plots Exp[–λ(1 – Q)] for λ = 1.2. The solution to Q = Exp[–λ(1 – Q)] is the point where the curves cross, at Q = 0.686. (B) In ten replicates of the process, six went extinct within four generations. The remaining four are plotted here; three survived indefinitely. (Numbers are plotted on a log scale, so that exponential growth appears as a straight line.)
| © 2007-2010 by Cold Spring Harbor Laboratory Press. All rights reserved. |
| The reproduction, modification, storage in a retrieval system, or retransmission, in any form or by any means, electronic, mechanical, or otherwise, for reasons other than personal, noncommercial use is strictly prohibited without prior written permission. You are authorized to download one copy of the material on this Web site for personal, noncommercial use only. The material made available on this Web site is protected by United States copyright laws and is provided solely for the use of instructors in teaching their courses and assessing student learning. Dissemination or sale of any of this material, as a whole or in parts (including on the World Wide Web), is not permitted. All users of these materials and visitors to this Web site are expected to abide by these restrictions. Requests for permission for other uses of this material should be directed to Cold Spring Harbor Laboratory Press, 1 Bungtown Road, Cold Spring Harbor, NY 11724 or submitted via our World Wide Web Site at http://www.cshlpress.com/. |