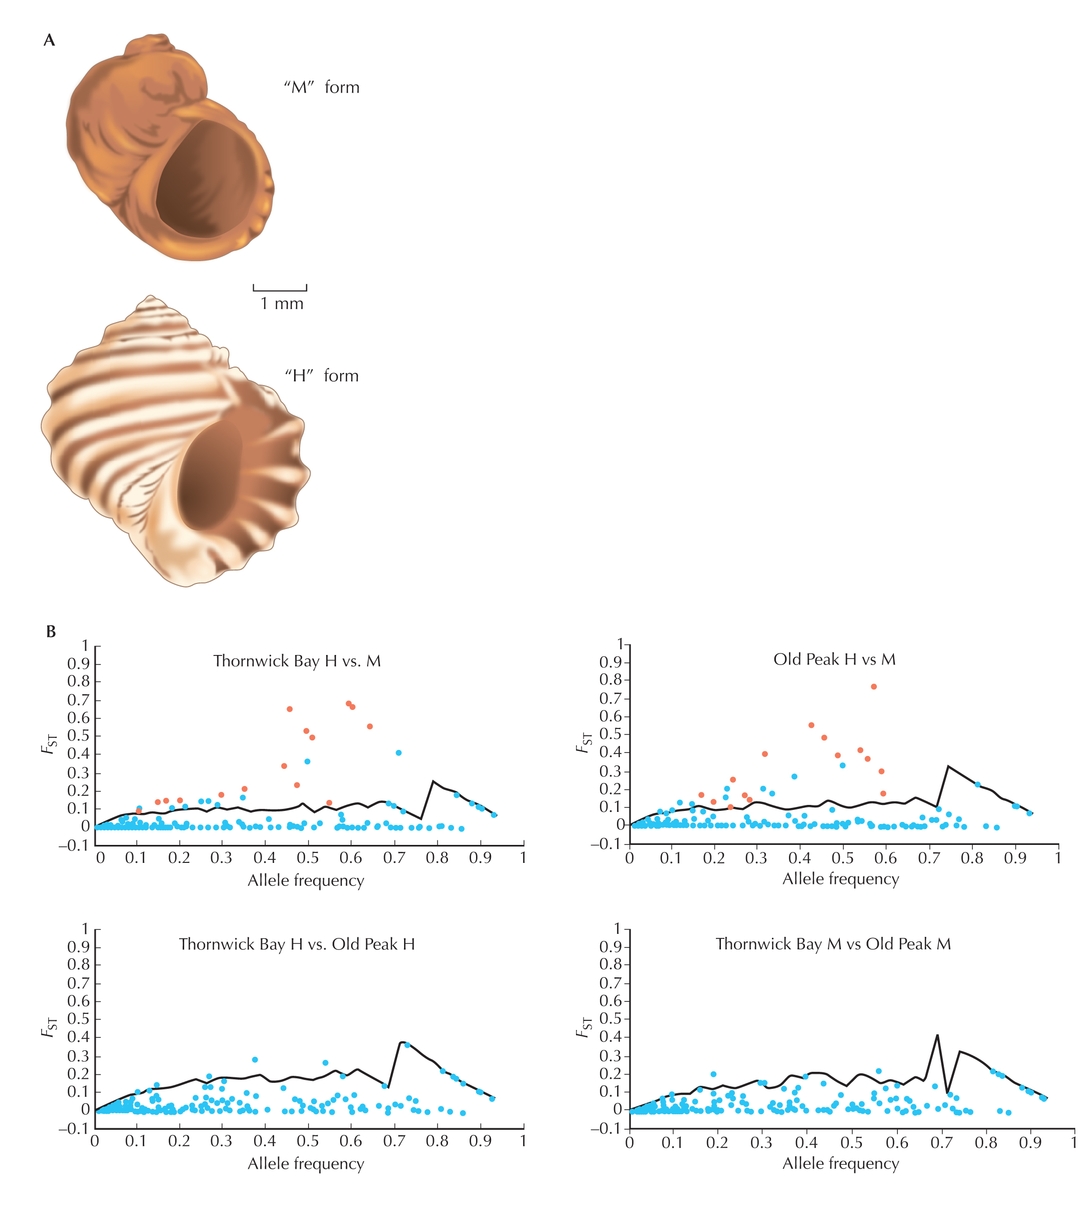
Figure WN16.1. (A) The periwinkle Littorina saxatilis has evolved two forms, called H and M, which are adapted to upper shore and lower shore, respectively. (B) The degree of divergence between populations relative to variation within them is measured by FST. This is plotted against allele frequency for 290 genetic markers. (Top two panels) Examples of divergence between the two different forms, separated by 300 meters or less. (Bottom panels) Divergence between different populations of the same form, 45 km apart. (Solid line) Statistical limit calculated by simulation. (Red) 15 loci showing a significant excess of divergence. (B, Redrawn from Wilding et al. 2001, Fig. 1.)
| © 2007-2010 by Cold Spring Harbor Laboratory Press. All rights reserved. |
| The reproduction, modification, storage in a retrieval system, or retransmission, in any form or by any means, electronic, mechanical, or otherwise, for reasons other than personal, noncommercial use is strictly prohibited without prior written permission. You are authorized to download one copy of the material on this Web site for personal, noncommercial use only. The material made available on this Web site is protected by United States copyright laws and is provided solely for the use of instructors in teaching their courses and assessing student learning. Dissemination or sale of any of this material, as a whole or in parts (including on the World Wide Web), is not permitted. All users of these materials and visitors to this Web site are expected to abide by these restrictions. Requests for permission for other uses of this material should be directed to Cold Spring Harbor Laboratory Press, 1 Bungtown Road, Cold Spring Harbor, NY 11724 or submitted via our World Wide Web Site at http://www.cshlpress.com/. |