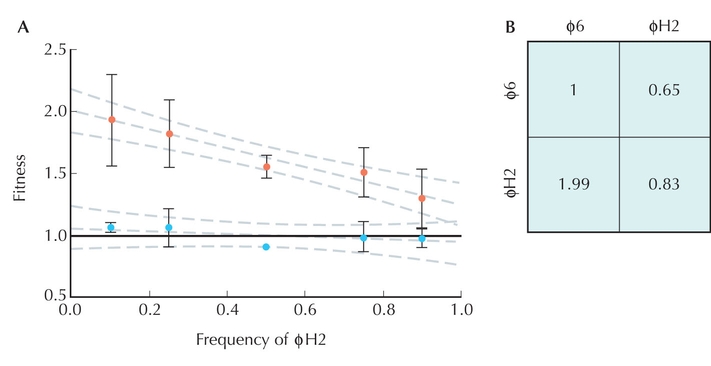
Figure WN20.8. (A) The fitness of φH2 relative to its ancestor φ6 decreases with frequency, but is still greater than 1 when it is common (red dots). Thus, φH2 will invade a population of φ6, but φ6 cannot invade φH2. Red dots show mean ± s.e.m.; dashed lines are regressions with 95% confidence intervals. The blue dots and lower lines show a control experiment, in which φ6 was competed against another clone identical except for the presence of a marker gene used in the fitness assay. (B) The payoff matrix estimated from A. Each entry gives the fitness of φ6 (top row) or φH2 (bottom row) when either φ6 (left) or φH2 (right) is common. (A, Redrawn from Fig. 2a in Turner and Chao 1999. B, Redrawn from Fig. 1b in Turner and Chao 1999.)
| © 2007-2010 by Cold Spring Harbor Laboratory Press. All rights reserved. |
| The reproduction, modification, storage in a retrieval system, or retransmission, in any form or by any means, electronic, mechanical, or otherwise, for reasons other than personal, noncommercial use is strictly prohibited without prior written permission. You are authorized to download one copy of the material on this Web site for personal, noncommercial use only. The material made available on this Web site is protected by United States copyright laws and is provided solely for the use of instructors in teaching their courses and assessing student learning. Dissemination or sale of any of this material, as a whole or in parts (including on the World Wide Web), is not permitted. All users of these materials and visitors to this Web site are expected to abide by these restrictions. Requests for permission for other uses of this material should be directed to Cold Spring Harbor Laboratory Press, 1 Bungtown Road, Cold Spring Harbor, NY 11724 or submitted via our World Wide Web Site at http://www.cshlpress.com/. |