Variation in Mutation Rates

Figure WN23.1.
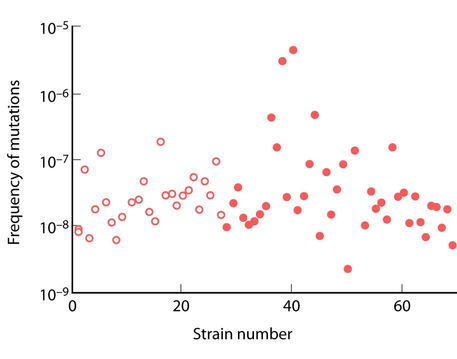
Variation in mutation rate across natural isolates of Escherichia coli. A total of 504 isolates were screened initially for their ability to produce mutants in the lacI gene; 69 out of 504 isolates produced mutations in the lacI gene, which gave an initial screen for high mutation rates. The figure shows the rate of mutation to rifampicin resistance among these 69 isolates. This averaged 2.6 × 10⁻⁷, but varied between less than 10–8 and more than 10–6. In several cases, high mutation rates were due to defects in the mismatch repair genes mutS and mutL. In contrast, the mutation rate among the remaining isolates, which did not produce mutants to lacI, was tightly clustered around 10–8. In this study, there was no significant difference in mutation rate between strains involved in various pathologies (filled circles) and nonpathogenic isolates (open circles). (Redrawn from Fig. 1 in Matic et al. 1997.)
|

