Evolution Chapter 13 Answers
|
Answer 13.1
|
| *i) |
Assuming random mating and no selection against cystic fibrosis alleles before birth, the frequency of homozygotes is expected to be the square of the allele frequency (recall Box 1.1, Hardy–Weinberg Law). Thus, p2 = 1/2000, and so p = 1/ ~ 0.022. ~ 0.022.
|
| *ii) |
The frequency of heterozygous carriers is expected to be 2pq = 2 × 0.022 × 0.978 = 0.0437. Therefore, the probability that two carriers will marry is 0.04372 = 0.0019, or about 1 in 520. This is approximately four times the incidence of the disease—consistent with the fact that 1/4 of offspring from two heterozygotes will be affected homozygotes. (We ignore marriages involving affected homozygotes because they are so rare.)
|
|
Answer 13.2
|
| *i) |
In this sample of ten individuals, 24/2000 sites are polymorphic, and so we estimate the probability that a site is polymorphic as 0.012. With a larger sample, this estimate would increase as we picked up rarer alleles.
|
| **ii) |
We could compare all possible pairs in the sample, but this would be tedious—there are 9 × 10/2 = 45 pairs. A quicker method is based on the allele frequencies, pi + qi = 1 (i = 1, ..., 24). The probability that a site will differ between two randomly chosen genes is 2piqi (from the Hardy–Weinberg formula; Box 1.1). The frequencies of the derived allele (i.e., the allele which is found in the study species and not the outgroup) are
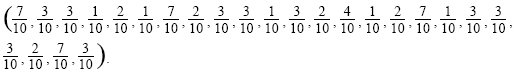
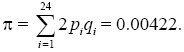
Calculating 2piqi for each of the 24 polymorphic sites, summing, and dividing by the total number of sites (n = 2000) gives an estimate of nucleotide diversity of
|
| **iii) |
Working from the leftmost column, the first mutation is shared by individuals 1–7; similarly, the second mutation is shared by individuals 8–10. These two groups must therefore form the two deepest-branching clades. The third mutation is shared by 5, 6, and 7, and so these must also form a clade. In this example, there are enough mutations to fully resolve the genealogy (Fig. P13.2).
|
| **iv) |
The problem is to find the number of differences that separate a pair of lineages and then divide by the time for which they have been diverging and the number of sites. If we take a random member of the sample and the outgroup X, then we can count the number of mutations that separate them. All pairs differ by the 52 fixed differences, but the total number varies from individual to individual: For example, 1 and X differ by 52 + 7 = 59 mutations. Averaging over the ten sequences, we find that these differ by on average 7.4 mutations from their common ancestor. On average, then, the total number of divergent mutations is 52 + 7.4 = 59.4. If the common ancestor of the pair lived at the time the two species were separated by a rising sea, 500,000 years ago, then the time available for them to accumulate mutations is twice that: 106 years. Therefore, the rate of divergence is 59.4/(2000 × 106) = 2.97 × 10⁻⁸ per site per year. NOTE 13A
|
| **v) |
Now, we can use this rate to estimate when the common ancestor of the ten sampled beetles lived. Along the branch leading down from the common ancestor of the ten down to any individual in the clade 1–7, there are four mutations on the deepest branch plus a number that varies from individual to individual and averages 3.42. Similarly, the number of mutations distinguishing the common ancestor and 8, 9, or 10 averages 7.32; the average of these is 7.37. Therefore, we estimate that the common ancestor of the ten sampled beetles lived 7.37/(2000 × 2.97 × 10–8) ~ 124,000 years ago. A simpler alternative would be to use the average of 7.4 mutations that separate the ten sequences from their common ancestor (see iii).
Note that this estimate is quite uncertain, because it depends mainly on the random number of mutations in the deepest part of the genealogy (four leading down to clade 1–7, and six leading down to clade 8–10).
An alternative method would be to use the average pairwise diversity, π, as estimated above. However, this would include pairs within the two deepest subclades (e.g., 1 and 7, 8 and 10) and so would underestimate the time to the MRCA.
|
| **vi) |
This analysis depends on the assumption that every difference that we see is due to a single mutational event. That will be accurate if the chance of a mutation at any particular site is low. (a) Within the sample of ten beetles, we see 24 mutations segregating at 2000 sites. Therefore, the chance of a change occurring at any one site is estimated as 24/2000 = 0.012. The chance that two changes would occur at a single site is (0.012)2, and so the expected total number of sites at which two changes have occurred is expected to be about 2000 × (0.012)2 = 0.288—a small number. (Note that 1/3 of such changes will take the site back to its original state and will not be detected, but 2/3 will produce a new state, via two mutations not one.) Neglecting multiple changes will make the estimate of mutation rates slightly low; here, however, the bias is much smaller than the large uncertainties in the estimates. (b) Two genes, one from each species, differ by an average of 59.4 changes at 2000 sites. Therefore we expect about 2000 × (59.4/2000)2 = 1.76 sites that have experienced multiple changes—still fairly small relative to the statistical errors. However, variation in mutation rate across sites can make it much more likely that multiple substitutions will occur at mutational hotspots.
|
|
Answer 13.3
|
| *i) |
The simplest genealogy connecting a–k (ignoring l, m for the moment) is shown in Figure P13.3. It includes 11 mutational changes. This is almost the minimum possible: Only the lineage connecting g with h has two changes.
|
| **ii) |
Haplotype l is most closely related to d and differs by two changes from it. Haplotype m is closest to d and j and differs by four changes from both.
|
| **iii) |
Chromosome l could be produced by a recombination between chromosomes d and h, somewhere between positions 5 and F/S. Then, no mutations need have occurred. Chromosome l could have been produced by a recombination between chromosomes d and j, between positions 3 and 4; two mutations would still be needed, however. NOTE 13B
|
| **iv) |
Pairs such as 10&11, 4&11, 2&10, and 1&F/S all show all four possible combinations. If you try to draw a genealogy connecting four sequences, showing all four combinations, you will soon see that it is impossible if mutations are unique and there is no recombination. Either of those two assumptions must be broken: Recombination has occurred or a mutation has been erased by a subsequent back-mutation. In other words, all pairs of sites must be in maximum linkage disequilibrium. Thus, looking for pairs of sites with all four combinations is a simple test for recombination or multiple hits.
|
|
Answer 13.4
|
| *i) |
Three of the 64 possible triplet codons code for “stop,” and so, on average, we expect a stop at every 64/3 = 21.3 codons.
|
| **ii) |
There are 3 × 300 sites that can mutate, and the chance that a random mutation will generate a stop codon is 3/63 = 0.048. Therefore, the rate at which stop codons arise somewhere in the sequence is 3 × 300 × 0.048 × 10–8 = 0.00000043. The expected time before a stop codon arises in the lineage is therefore 1/0.00000043 ~ 2.3 × 10⁶ generations: Neutral decay is a slow process (see p. 711). NOTE 13C
|
|
Answer 13.5
|
| *i) |
If the common ancestor lived T years ago, then the two descendant lineages have been diverging for 2T years. The probability that a site will stay the same over this time is (1 – μ)2T, with μ = 3 × 10⁻⁹ per year. Setting this equal to 0.79 gives an estimate of approximately 39 million years for mouse and rat; setting it to 0.67 gives approximately 67 million years for human and mouse.
|
| **ii) |
The chance that a site is the same in mouse and rat is the chance that it stays the same along both lineages leading from the common ancestor: α2 = 0.79, and so α = 0.89. Similarly, the chance of identity between human and mouse is αβ = 0.67, and so β ~ 0.75.
|
| **iii) |
The chance that all three are identical is α2β ~ 0.60. (We ignore multiple changes, such that a second mutation cancels the first giving no apparent change.)
|
| **iv) |
The chance that 100 successive bases would all stay the same in the three species is 0.60100 ~ 6.5 × 10⁻²³. Even given the large size of the human genome (2.9 × 10⁹ bases), it would be vanishingly unlikely that 100 base pairs would remain unchanged for such a long time. NOTE 13D
|
|
Answer 13.6
|
| *i) |
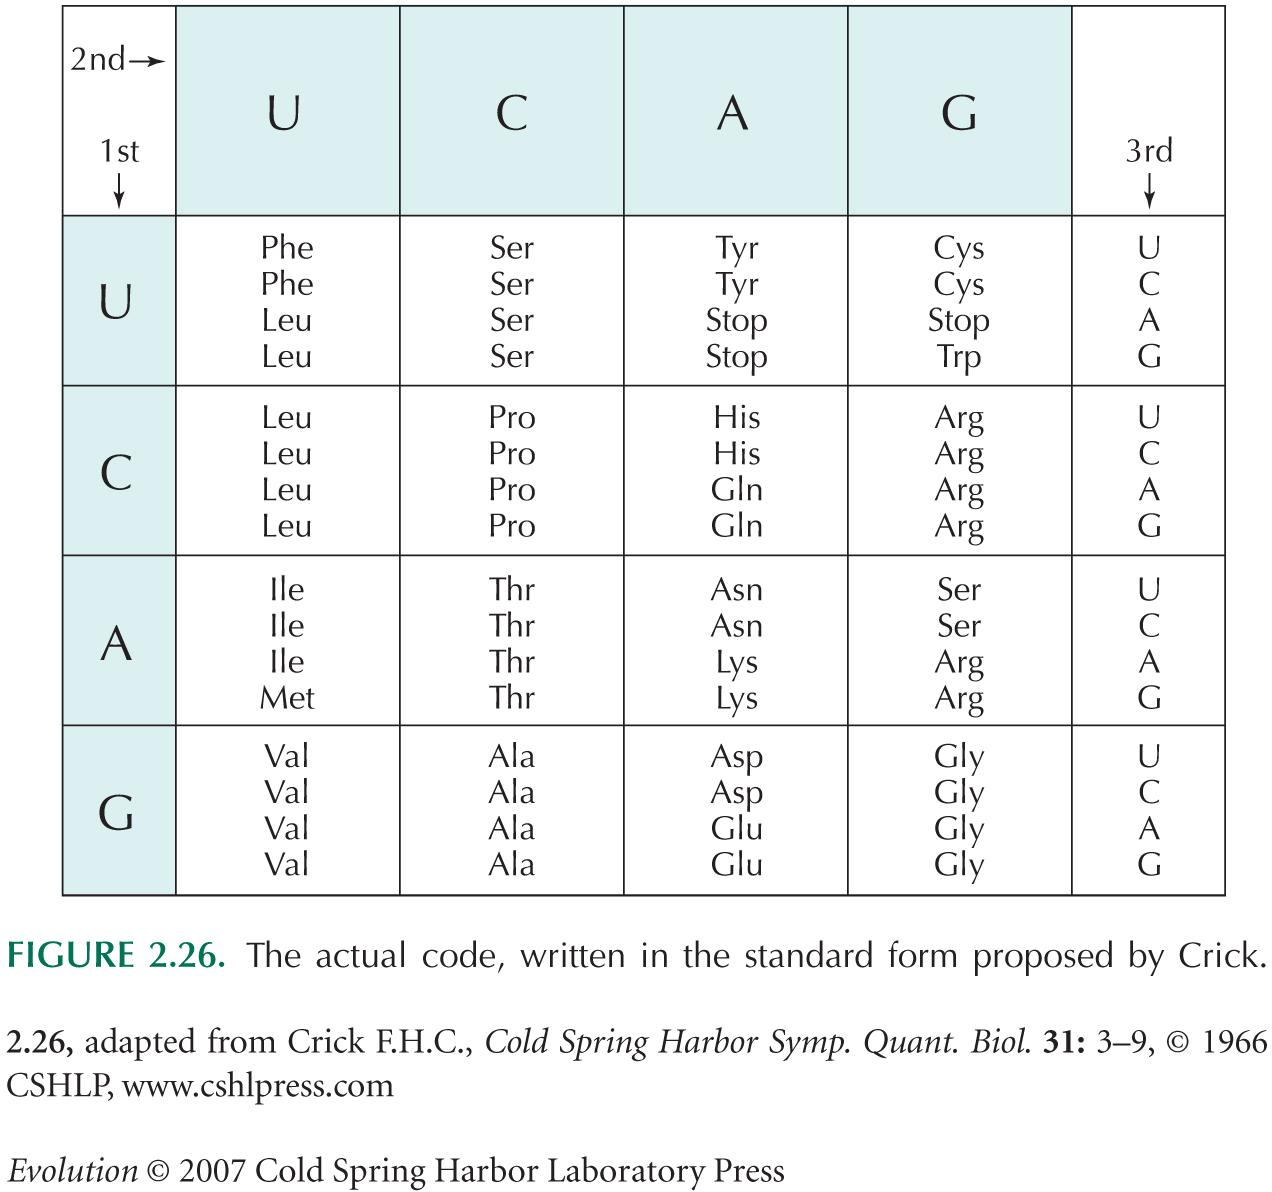
For example, if leucine is coded by UUA or UUG (top left cell of Fig. P13.5), then 1/3 of changes at the first position will take it to CUA or CUG, which also code for leucine. Of the 16 codons in the first column, 4 code for leucine in this way; thus, mutations to codons in the first column have a chance 4 × (1/3)/16 = 1/12 of being synonymous. For codons in the second and third columns (i.e., second position C or A), any change at the first position will change the amino-acid. Finally, the same argument applies to arginine in the fourth column as for leucine in the first, giving a probability of 1/12 again. Averaging over the four columns, we find that the probability of a synonymous mutation is 1/24 ~ 0.042.
|
| **ii) |
Changes to the second position correspond to changes in the column in Figure 2.26. Clearly, no such changes leave the amino acids the same. Changes to the third position correspond to changes within the 16 cells of Figure 2.26. In eight of the cells, all mutations to the third position are synonymous (UCx, CUx, CCx, CGx, ACx, GUx, GCx, GGx). For the four codons UUx, two code for phenylalanine and two for leucine; thus, 1/3 of changes are synonymous. There are six cells of this kind. AUx contains three codons (for isoleucine) for which 2/3 of changes do not alter the amino acid and one (for methionine) for which all changes alter it; the average fraction of synonymous mutations is (3/4) × (2/3) = 1/2. Finally, UGU and UGC code for cysteine, for which 1/3 of changes are synonymous, and UGG codes for tryptophan, for which there are no synonymous mutations; the average is (2/3) × (1/3) = 2/9. Averaging over all 16 cells, we have a fraction (6/16) × (1/3) + (8/16) × 1 + (1/16) × (1/2) + (1/16) × (2/9) ~ 0.67. About 2/3 of random changes to the third position are synonymous. NOTE 13E
|
| ***iii) |
What would we expect if the code were entirely random? A rough argument is that each of the 20 amino acids is coded by (on average) approximately 64/20 = 3.2 codons. Therefore, if one of these codons changes to another, the amino acid will stay unchanged only if it changes to one of the approximately 2.2 that code for the same amino acid: the probability that this will happen is 2.2/63 ~ 0.03—much lower than the probability of 0.23 of synonymous mutations with the actual code. (These arguments ignore the different frequencies of the amino acids and codons in actual DNA and protein sequences and the different numbers of codons that code for each amino acid; however, a more careful calculation gives a similar answer.)
|
NOTE 13F
References
Bejerano G., Pheasant M., Makunin I., Stephen S., Kent W.J., Mattick J.S., and Haussler D. 2004. Ultraconserved elements in the human genome. Science 304: 1321–1325.
Hardison R.C., Roskin K.M., Yang S., Diekhans M., Kent W.J., Weber R., Elnitski L., Li J., O’Connor M., Kolbe D., Schwartz S., Furey T.S., Whelan S., Goldman N., Smit A., Miller W., Chiaromonte F., and Haussler D. 2003. Covariation in frequencies of substitution, deletion, transposition, and recombination during Eutherian evolution. Genome Res. 13: 13–26.
Hoffman M.M. and Birney E. 2007. Estimating the neutral rate of nucleotide substitution using introns. Mol. Biol. Evol. 24: 522–531.
Knight R.D., Freeland S.J., and Landweber L.F. 2001. Rewiring the keyboard: Evolvability of the genetic code. Nat. Rev. Genet. 2: 49–58.
|


