|
Problem 15.1 *C28*
A mutation arises in a single bacterial cell; these bacteria reproduce synchronously in discrete generations. In each generation, those carrying the new allele have a 1/3 chance of dying and a 2/3 chance of dividing to produce two daughter cells.
|
| *i) |
What is the probability that there are 0, 1, 2,... copies of the new allele after two generations? HINT 15A
|
| *ii) |
What is the expected number of copies after ten generations?
|
| **iii) |
What is the probability, Q, that the mutant allele will ultimately be lost? HINT 15B
|
| *iv) |
Now, suppose that instead of reproducing in discrete generations, the bacteria reproduce continuously through time. After 1 minute, a bacterium carrying the new allele has a 1% chance of dying and 2% of dividing. Sketch the expected number of copies over time. HINT 15C
|
| **v) |
What is the chance, Q, of ultimate loss?
|
| **vi) |
What is the expected number of copies, given that the allele is not lost?
|
|
Problem 15.2
A large diploid population is divided up into many small populations, each with N = 20 individuals, and reproducing according to the Wright–Fisher model. An allele is initially at frequency p = 0.3 in each of the populations.
|
| **i) |
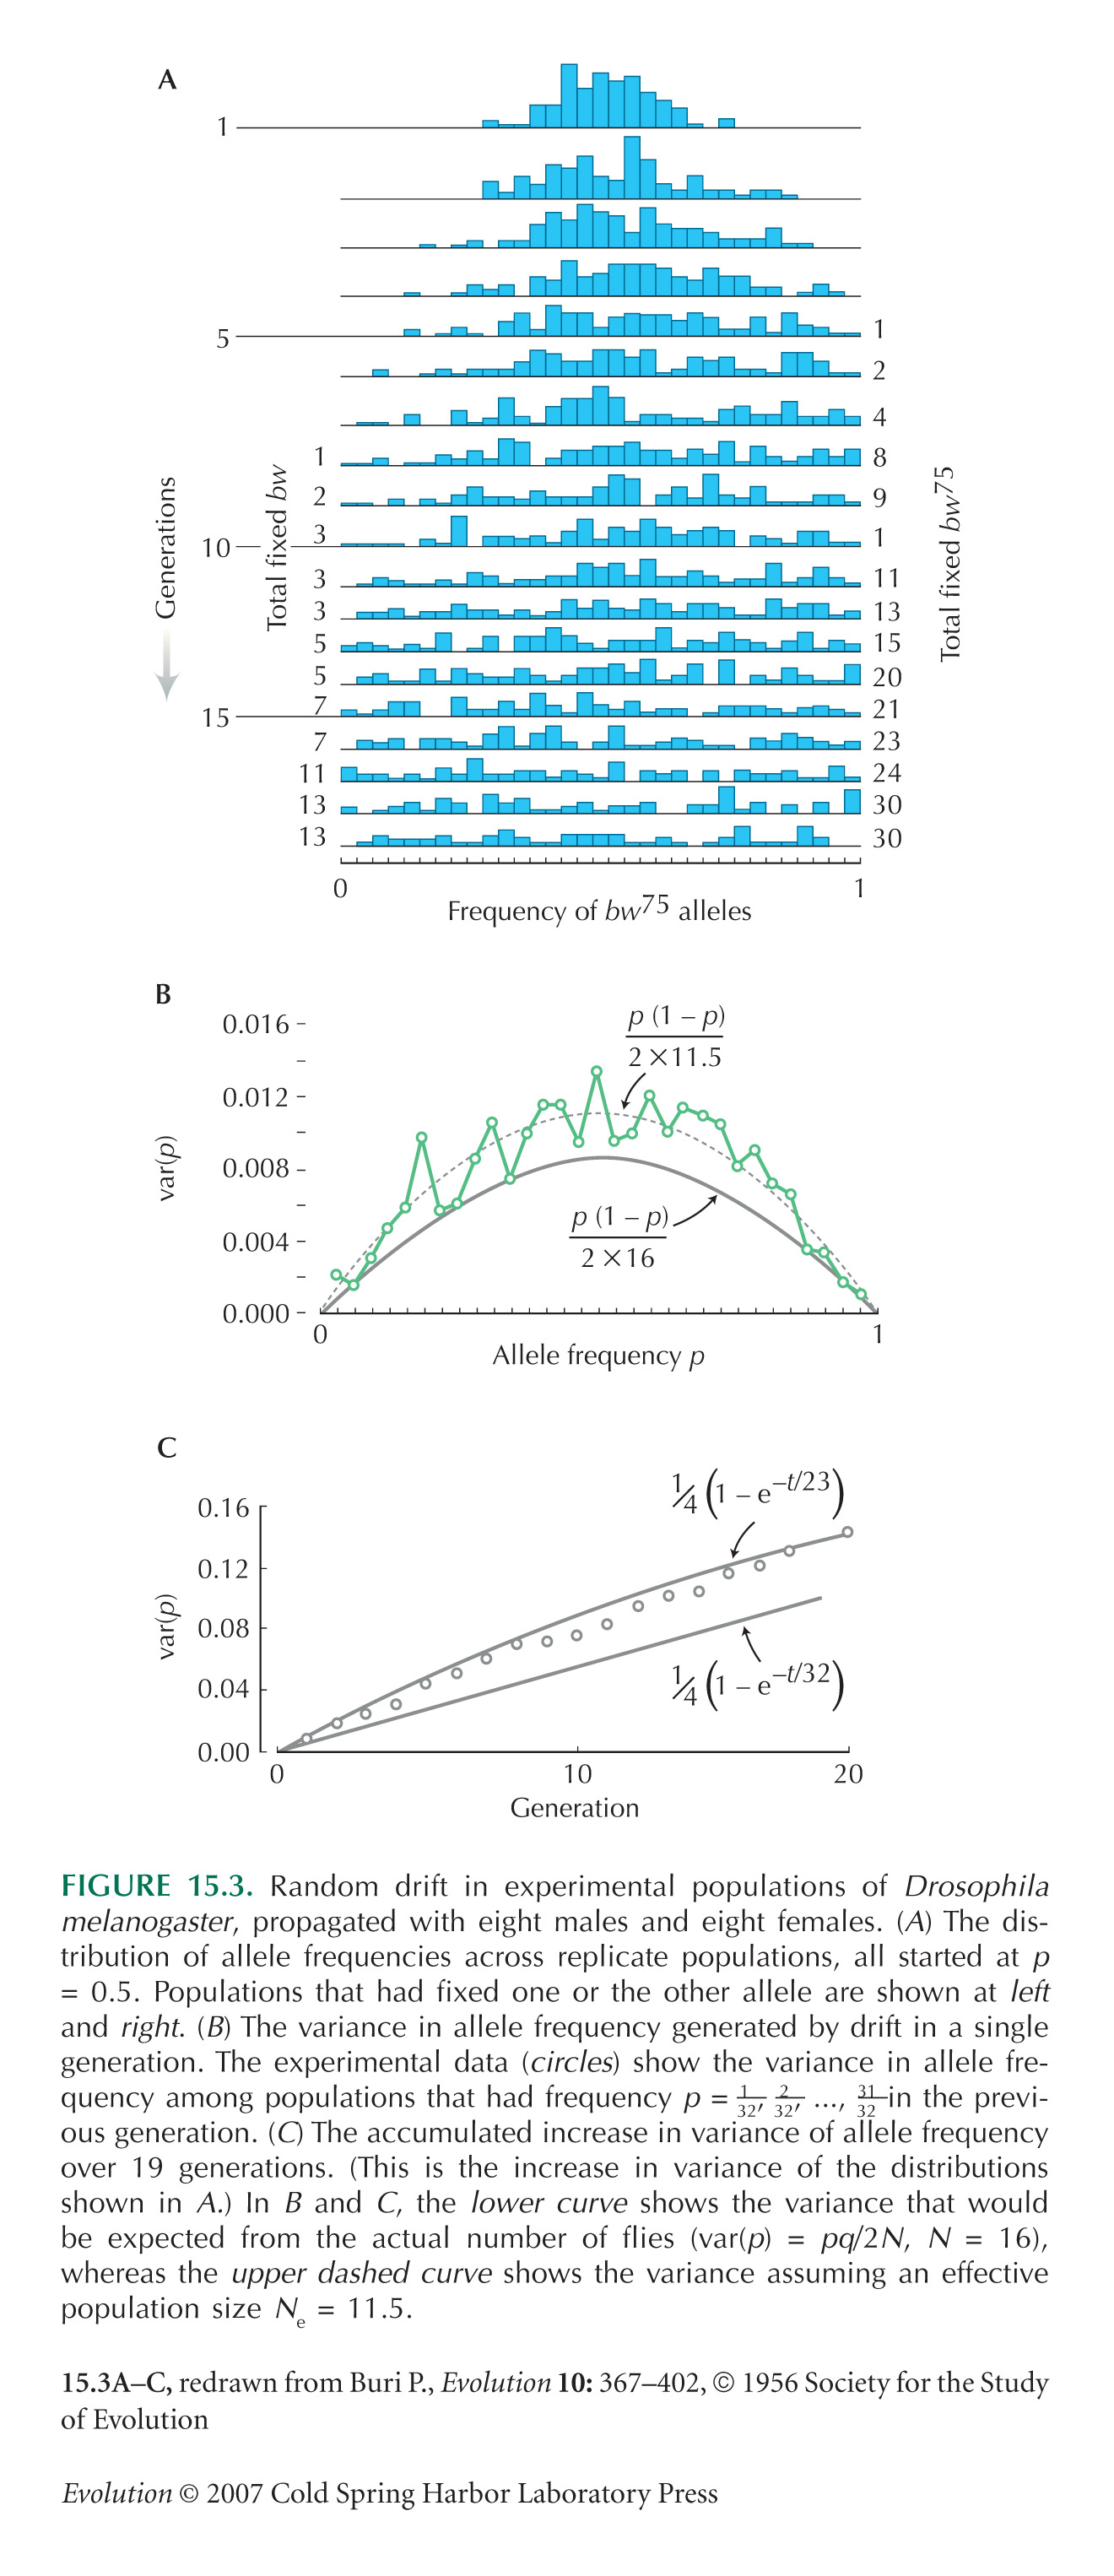
What is the variance of allele frequency after one generation? After ten generations? After 40 generations? Sketch the distributions of allele frequency. HINT 15D
|
| **ii) |
What is the chance that an individual within any of these populations will be heterozygous at these times? HINT 15E
|
|
Problem 15.3 *C28*
The diffusion approximation gives differential equations that describe how the distribution of allele frequencies evolves over time (Chapter 28). These equations depend on the expected change in allele frequency over one generation, M, and the variance in this change, V. They describe the probabilities A0, A1 of being fixed at p = 0 or 1, and the distribution of allele frequencies in populations that are still polymorphic, ψ(p). Initially, A0 = A1 = 0, and ψ(p) is clustered around the initial frequency, p0.
|
| ***i) |
For a neutral allele, write down the equations for the rates of change of ψ, A0, A1.
|
| ***ii) |
Assume that the distribution of frequencies in polymorphic populations is uniform (i.e., independent of p), as in Figure 15.3A. Show that it declines exponentially at rate 1/2Ne (i.e., ψ(p) = C exp(–t/2Ne), where C is a constant).
|
| ***iii) |
Show that the probabilities of being fixed at p = 0, 1 have the form A0 = C0 – (C/2) exp(–t/2Ne), A1 = C1 – (C/2) exp(–t/2Ne), where C0, C1 are constants.
|
| ***iv) |
The probabilities of being fixed and of being polymorphic must sum to 1 (A0 + C exp(–t/2Ne) + A1 = 1); the mean allele frequency must stay constant (p0 = A0 × 0 + C exp(–t/2Ne) × 1/2 + A1 × 1); and the variance of allele frequency must equal p0q0(1 – exp(–t/2Ne)) (Box 15.1). Because the variance is defined as the mean square deviation, this last constraint is that p0q0(1 – exp(–t/2Ne)) = A0 × (–p0)2 + C exp(–t/2Ne) × (1/3 – p0q0) + A1 × (1 – p0)2. (The average of (x – p0)2, with x uniformly distributed, is 1/3 – p0q0.) Find the probability C exp(–t/2Ne) that a population will still be polymorphic at time t.
|
|
Problem 15.4
A population of deer is reduced to an effective size of Ne = 15. Initially, antler size has heritability 50%; this heritable variation is largely additive.
|
| **i) |
What will the heritability be after 30 generations? (Assume that variation is not replenished by immigration or mutation.) HINT 15F
|
| **ii) |
In each generation, mutation increases the additive genetic variance by 1/200 of the environmental variance (i.e., Vm = 0.005VE). What is the heritability at equilibrium? HINT 15G
|
| ***iii) |
Random drift will cause the trait mean to fluctuate randomly. What will the standard deviation of the trait mean be after 30 generations? What will it be in the indefinite future once all genetic variation within the population has been lost? HINT 15H
|
|
Problem 15.5
Calculate the effective population size for the following cases.
|
| *i) |
Most of the time, a population consists of 1000 individuals, but this falls to ten individuals in every hundredth generation. HINT 15I
|
| *ii) |
Ten males and 90 females.
|
| **iii) |
100 individuals; both sexes have a distribution of offspring number as below HINT 15J:
|
|
Problem 15.6
Bees, ants, and most other truly social insects are haplodiploid: Males develop from unfertilized eggs and are haploid, whereas females develop from fertilized eggs and are diploid (Box 21.2).
|
| *i) |
What is the coefficient of kinship between a queen and her daughter (a female worker)? HINT 15K What is the coefficient of kinship between two daughters? Assume that the queen is outbred and mated to a single male.
|
| *ii) |
What are these coefficients if the queen mated to many different males?
|
|
Problem 15.7
A recessive allele that causes a genetic disease when homozygous has frequency 1 in 200 in the population. Two cousins mate.
|
| *i) |
What is the probability that two genes at the disease locus are identical by descent in the cousins’ offspring? HINT 15L
|
| *ii) |
What is the chance that the offspring suffers from the disease?
|
| **iii) |
If the maternal grandparents of the cousins were themselves offspring from a mating between cousins, what would the answers to i) and ii) be?
|
| ***iv) |
Suppose that 10% of offspring in a population are from marriages between cousins. What would the incidence of the disease be?
|
|
Problem 15.8 *C28*
Genes are sampled from a population with constant effective size Ne. Their ancestry is described by the coalescent process, in which any pair of lineages coalesce at a rate 1/2Ne.
|
| *i) |
If two genes are sampled, what is the expected time back to their most recent common ancestor (MRCA)? HINT 15M
|
| **ii) |
If three genes are sampled, what is the expected time back until their three ancestral lineages coalesce into two? HINT 15N What is the expected time back to the MRCA of the whole sample of three?
|
| **iii) |
What is the expected time back to the MRCA of a sample of five genes? HINT 15O
|
| ***iv) |
A sixth gene is sampled. What is the chance that this sample of six has an older MRCA than that of the original sample of five? HINT 15P
|
|
Problem 15.9
A sample of n = 10 homologous DNA sequences, 10 kb long, is taken from a population of constant effective size Ne = 500,000. Mutations occur at a rate μ = 5 × 10⁻⁹ per site per generation.
|
| *i) |
What is the nucleotide diversity, π? HINT 15Q
|
| **ii) |
How many sites are expected to be polymorphic in this sample? In other words, what is the number of segregating sites?
|
| ***iii) |
Suppose now that the population had recently gone through a brief and very drastic reduction in size so that almost all lineages coalesced during the bottleneck. You can assume that the bottleneck was so recent that there has been no coalescence since it occurred. For the same pairwise diversity as in i), what is the expected number of segregating sites?
|
|
Problem 15.10 *C28*
A sample of mitochondrial DNA sequences, each 1 kb long, is taken from a population of constant size, Ne = 106. The mutation rate is 3 × 10⁻⁹ per site per generation.
|
| *i) |
What is the mean and variance of the number of differences between a randomly chosen pair of sequences? HINT 15R Sketch the distribution of the number of pairwise differences.
|
| **ii) |
How would the distribution differ if the sample came from a population with the same pairwise diversity, but in which all the coalescence occurred during a drastic bottleneck at some time in the past? HINT 15S
|
|
Problem 15.11
Table P15.1 shows the pattern of sequence variation in a random sample of 20 sequences from human chromosome 21; variation in 12 kb of sequence is shown.
|
| **i) |
What are the allele frequencies at the 15 polymorphic sites? What is the nucleotide diversity, π? HINT 15T
|
| **ii) |
How many haplotypes are present in the sample? How many possible haplotypes are there? What is the commonest haplotype? How frequent would you expect the commonest haplotype to be if variation was combined at random, in linkage equilibrium?
|
| **iii) |
What is the pairwise linkage disequilibrium, D, between the first and second sites? HINT 15U. What is the pairwise linkage disequilibrium between the first and last sites? (Each row corresponds to a site in the sequence.) What are D′ and r (see Box 15.5)?
|
| ***iv) |
Is it possible to construct a genealogy that relates the 20 sequences, on the assumption that every mutation is unique? (There is no outgroup here, so either 0 or 1 could be ancestral.) HINT 15V HINT 15W
|
|
Problem 15.12 *C28*
The genealogy at a site in the genome is shown in Figure P15.1.
|
| **i) |
Moving along the genome, at some point, a recombination occurs, and so the genealogy at the linked site may be different. How far from the original site is this first recombination event likely to be? HINT 15X
|
| ***ii) |
What is the chance that the common ancestor at the linked site will be earlier than 20,000 generations?
|
|
Problem 15.13
A single genome is sampled, and the ancestry of two sites, 0.01 cM apart, is traced backward through time. The effective population size is Ne = 10,000. As we trace back, we will find that the lineages are sometimes in different individuals but sometimes are linked together in the same genome. What fraction of the time are the ancestral lineages linked together on average? HINT 15Y
|


