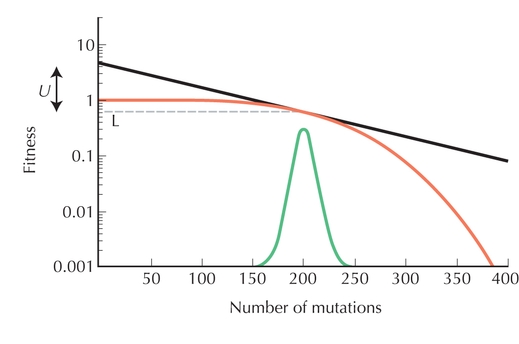
Figure P23.6. (Upper curve) How fitness decreases with the number of deleterious mutations, as in Figure P23.2. (Bell-shaped curve) Distribution of the number of deleterious mutations at equilibrium with U = 2. (Dashed line) Equilibrium mean fitness, at exp(–0.5) = 0.61; (solid line) tangent to the upper curve, and so its slope gives the selection coefficient against deleterious mutations, s = 0.01. Because the mean number of deleterious mutations is U/s, the distance between the dashed line and the intercept of the tangent equals U, which here equals 2. (The vertical scale is logarithmic, and so the distance between 0.1 and 1 [say] is loge(10) = 2.30.)
| © 2007-2010 by Cold Spring Harbor Laboratory Press. All rights reserved. |
| The reproduction, modification, storage in a retrieval system, or retransmission, in any form or by any means, electronic, mechanical, or otherwise, for reasons other than personal, noncommercial use is strictly prohibited without prior written permission. You are authorized to download one copy of the material on this Web site for personal, noncommercial use only. The material made available on this Web site is protected by United States copyright laws and is provided solely for the use of instructors in teaching their courses and assessing student learning. Dissemination or sale of any of this material, as a whole or in parts (including on the World Wide Web), is not permitted. All users of these materials and visitors to this Web site are expected to abide by these restrictions. Requests for permission for other uses of this material should be directed to Cold Spring Harbor Laboratory Press, 1 Bungtown Road, Cold Spring Harbor, NY 11724 or submitted via our World Wide Web Site at http://www.cshlpress.com/. |