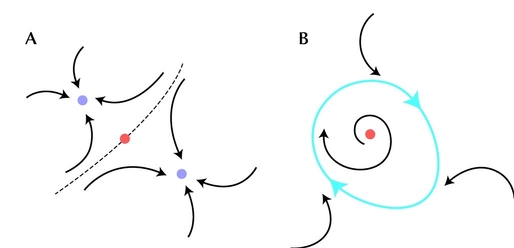
Figure 28.10. (A) If there is more than one stable equilibrium, then where the population ends up depends on its initial state. The diagram shows two stable equilibria (purple dots) separated by an unstable equilibrium (red dot). The dotted line separates the domains of attraction of the two stable equilibria. (B) There may be no stable equilibria, in which the population will change continually. This diagram shows a stable limit cycle (blue), which encloses an unstable equilibrium (red dot).
| © 2007-2010 by Cold Spring Harbor Laboratory Press. All rights reserved. |
| The reproduction, modification, storage in a retrieval system, or retransmission, in any form or by any means, electronic, mechanical, or otherwise, for reasons other than personal, noncommercial use is strictly prohibited without prior written permission. You are authorized to download one copy of the material on this Web site for personal, noncommercial use only. The material made available on this Web site is protected by United States copyright laws and is provided solely for the use of instructors in teaching their courses and assessing student learning. Dissemination or sale of any of this material, as a whole or in parts (including on the World Wide Web), is not permitted. All users of these materials and visitors to this Web site are expected to abide by these restrictions. Requests for permission for other uses of this material should be directed to Cold Spring Harbor Laboratory Press, 1 Bungtown Road, Cold Spring Harbor, NY 11724 or submitted via our World Wide Web Site at http://www.cshlpress.com/. |