HINT 19A: Find the change in the estimated mean, divided by the standard deviation of this estimate. (The variance of the mean is one-tenth the estimated variance among the ten replicate cages.) A change of more than about two standard deviations is unlikely to occur by chance.
HINT 19B: Begin by finding how the ratio of allele frequencies changes.
HINT 19C: The number of P alleles in a sample of n genes, jP, follows a binomial distribution. The variance of allele frequency, jP/n, is pq/n, where p is the allele frequency.
HINT 19D: See Box 15.1.
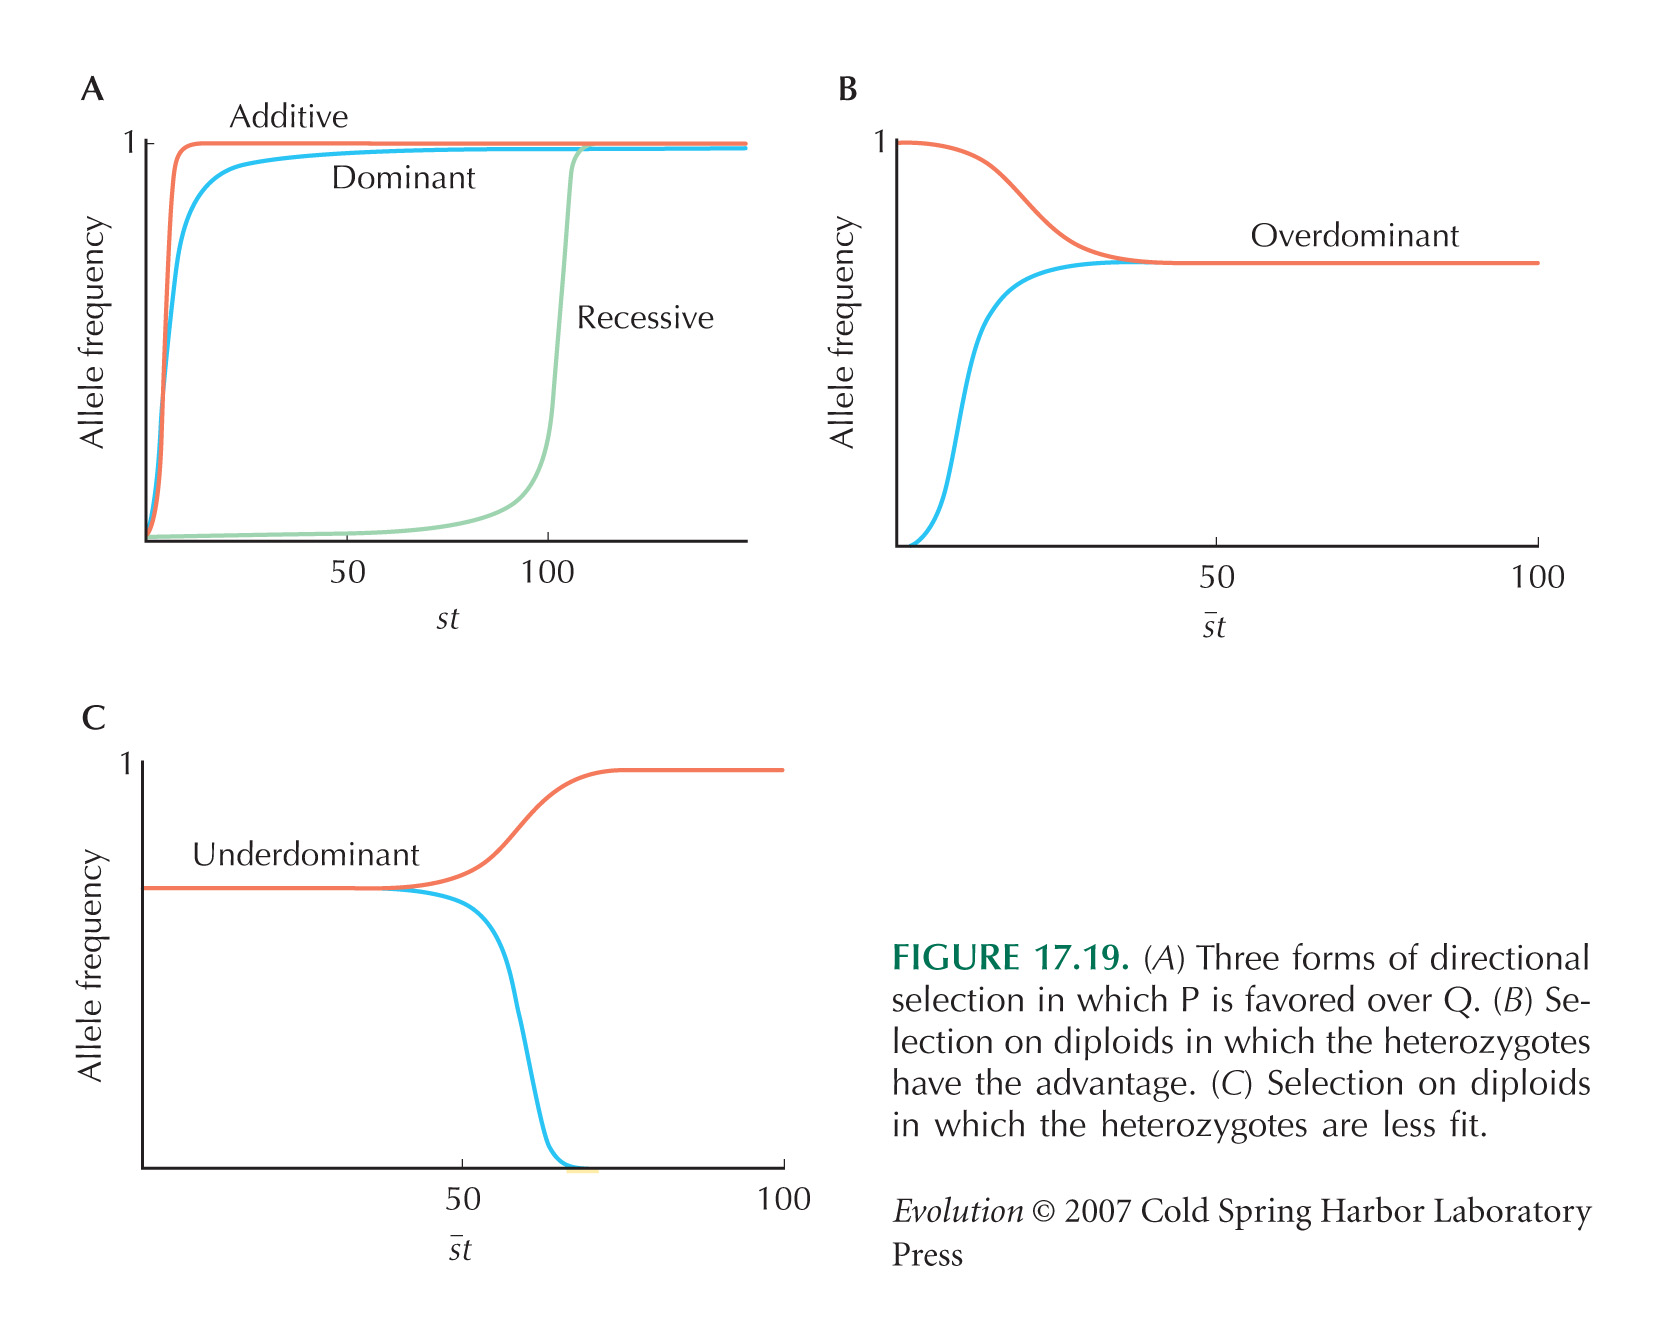
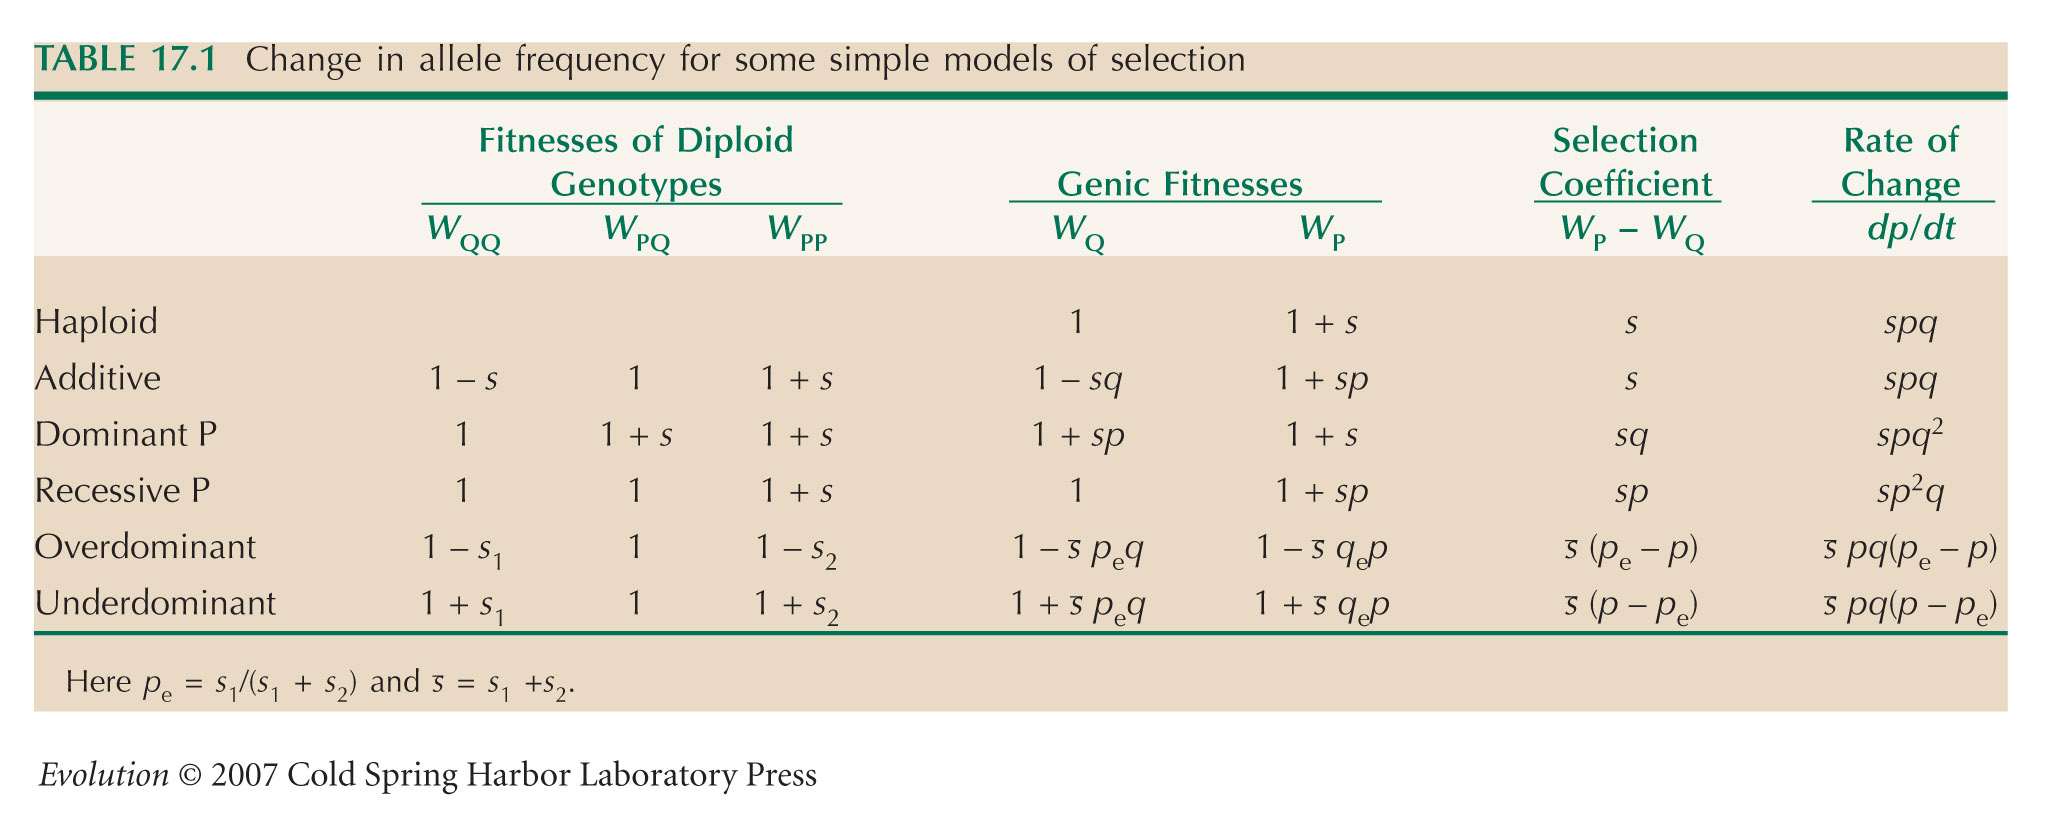
HINT 19E: See Figure 17.19B. Make (rough) quantitative estimates of the increase in ratio of allele frequency, the equilibrium frequency, and selection coefficient (see Table 17.1).
HINT 19F: Assume Hardy–Weinberg proportions.
HINT 19G: See page 504.
HINT 19H: Use the approximation that (1 – λ)t ~ exp(–λt) (Chapter 28).
HINT 19I: Equate the result from ii) to the fraction of sites with no change.
HINT 19J: The number of substitutions follows a Poisson distribution (Chapter 28).
HINT 19K: Think about the constraints imposed by the genetic code.
HINT 19L: The observed number of differences is less than the actual number, because multiple substitutions appear as a single change. The actual number can be estimated from the fraction of sites that stays unchanged, Q, which is exp(–2λT).
HINT 19M: The product θ(θ + 1) ··· (θ + 11) = 39916800 θ + 120543840 θ2 + 150917976 θ3 + 105258076 θ4 + 45995730 θ5 + 13339535 θ6 + 2637558 θ7 + 357423 θ8 + 32670 θ9 + 1925 θ10 + 66 θ11 + θ12.
HINT 19N: The only configuration of four alleles with as much or more homozygosity is 9:1:1:1.
HINT 19O: The difference between observed and expected nonsynonymous divergence can be attributed to positive selection.
HINT 19P: Recall Equation 17.2.
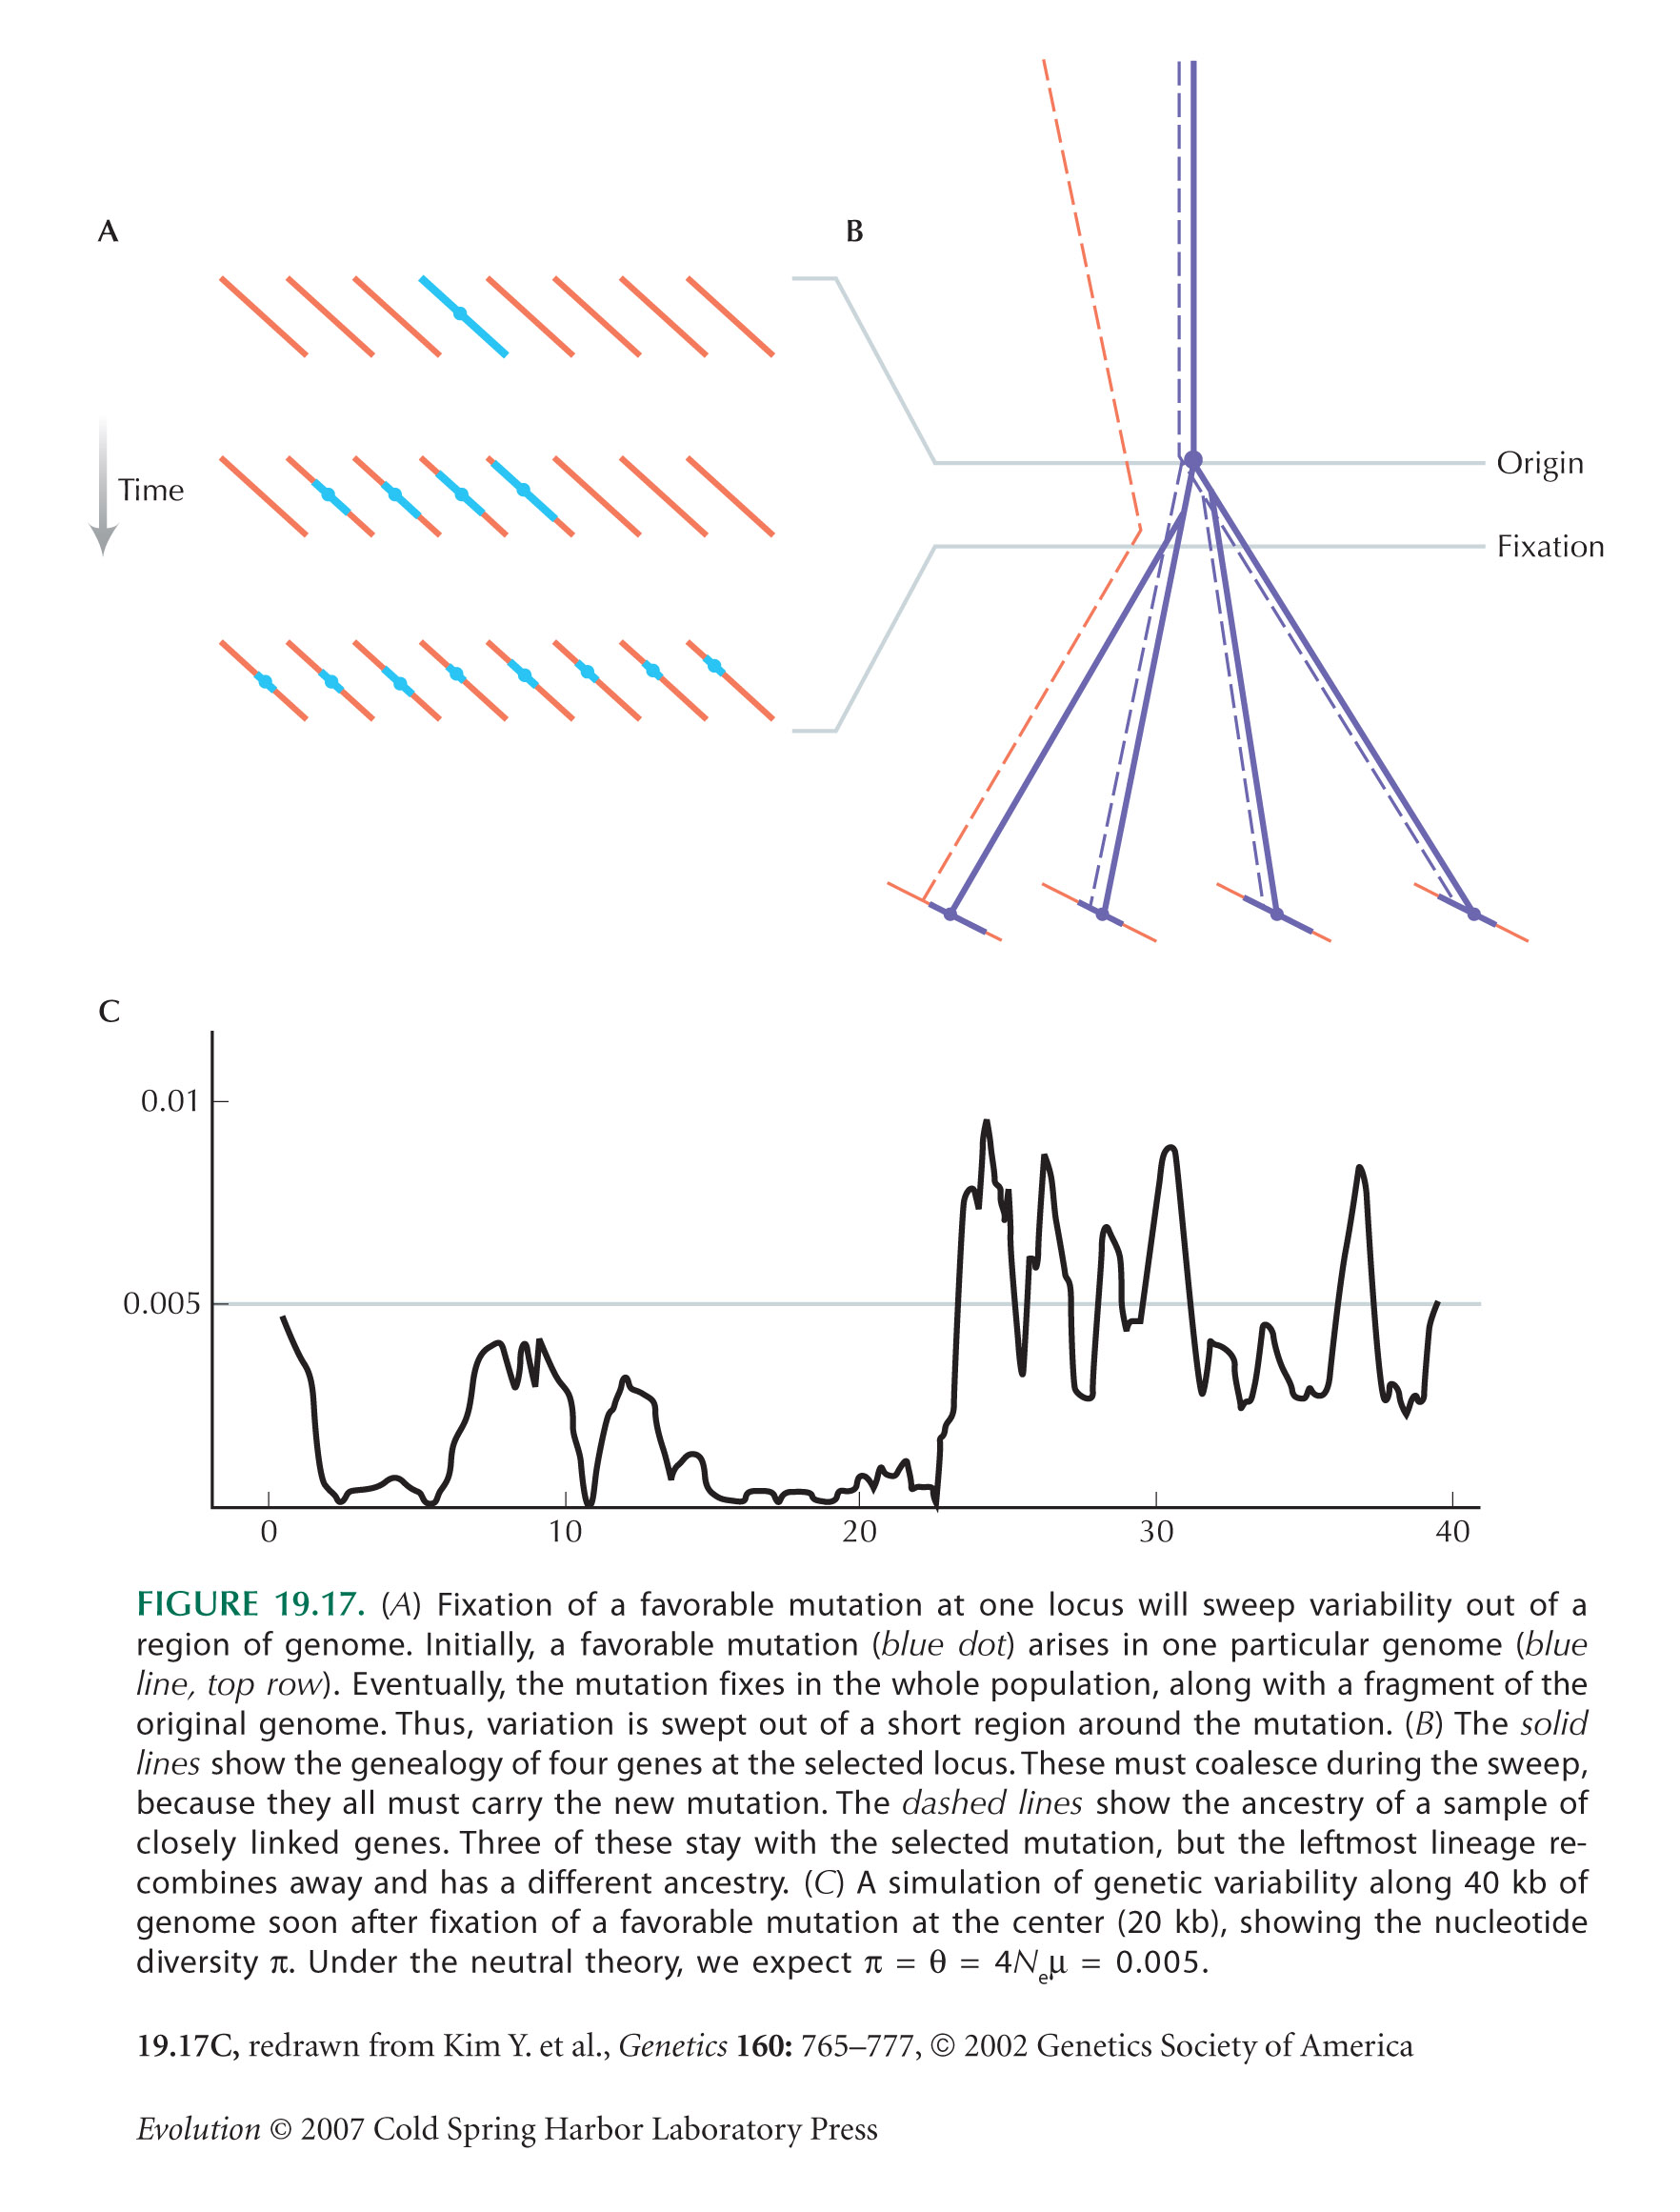
HINT 19Q: Recall Figure 19.17A,B.
HINT 19R: If two lineages both trace back to the single genome that carried the favorable mutation, without recombination, then they are identical by descent.
HINT 19S: Fitting a curve by eye will do.
HINT 19T: See page 426.
HINT 19U: Work out the diversity for pairs of genes that are linked to the same allele and that are linked to different alleles.
HINT 19V: Ignore the possibility that lineages coalesce more recently than 105 generations ago (see p. 542).
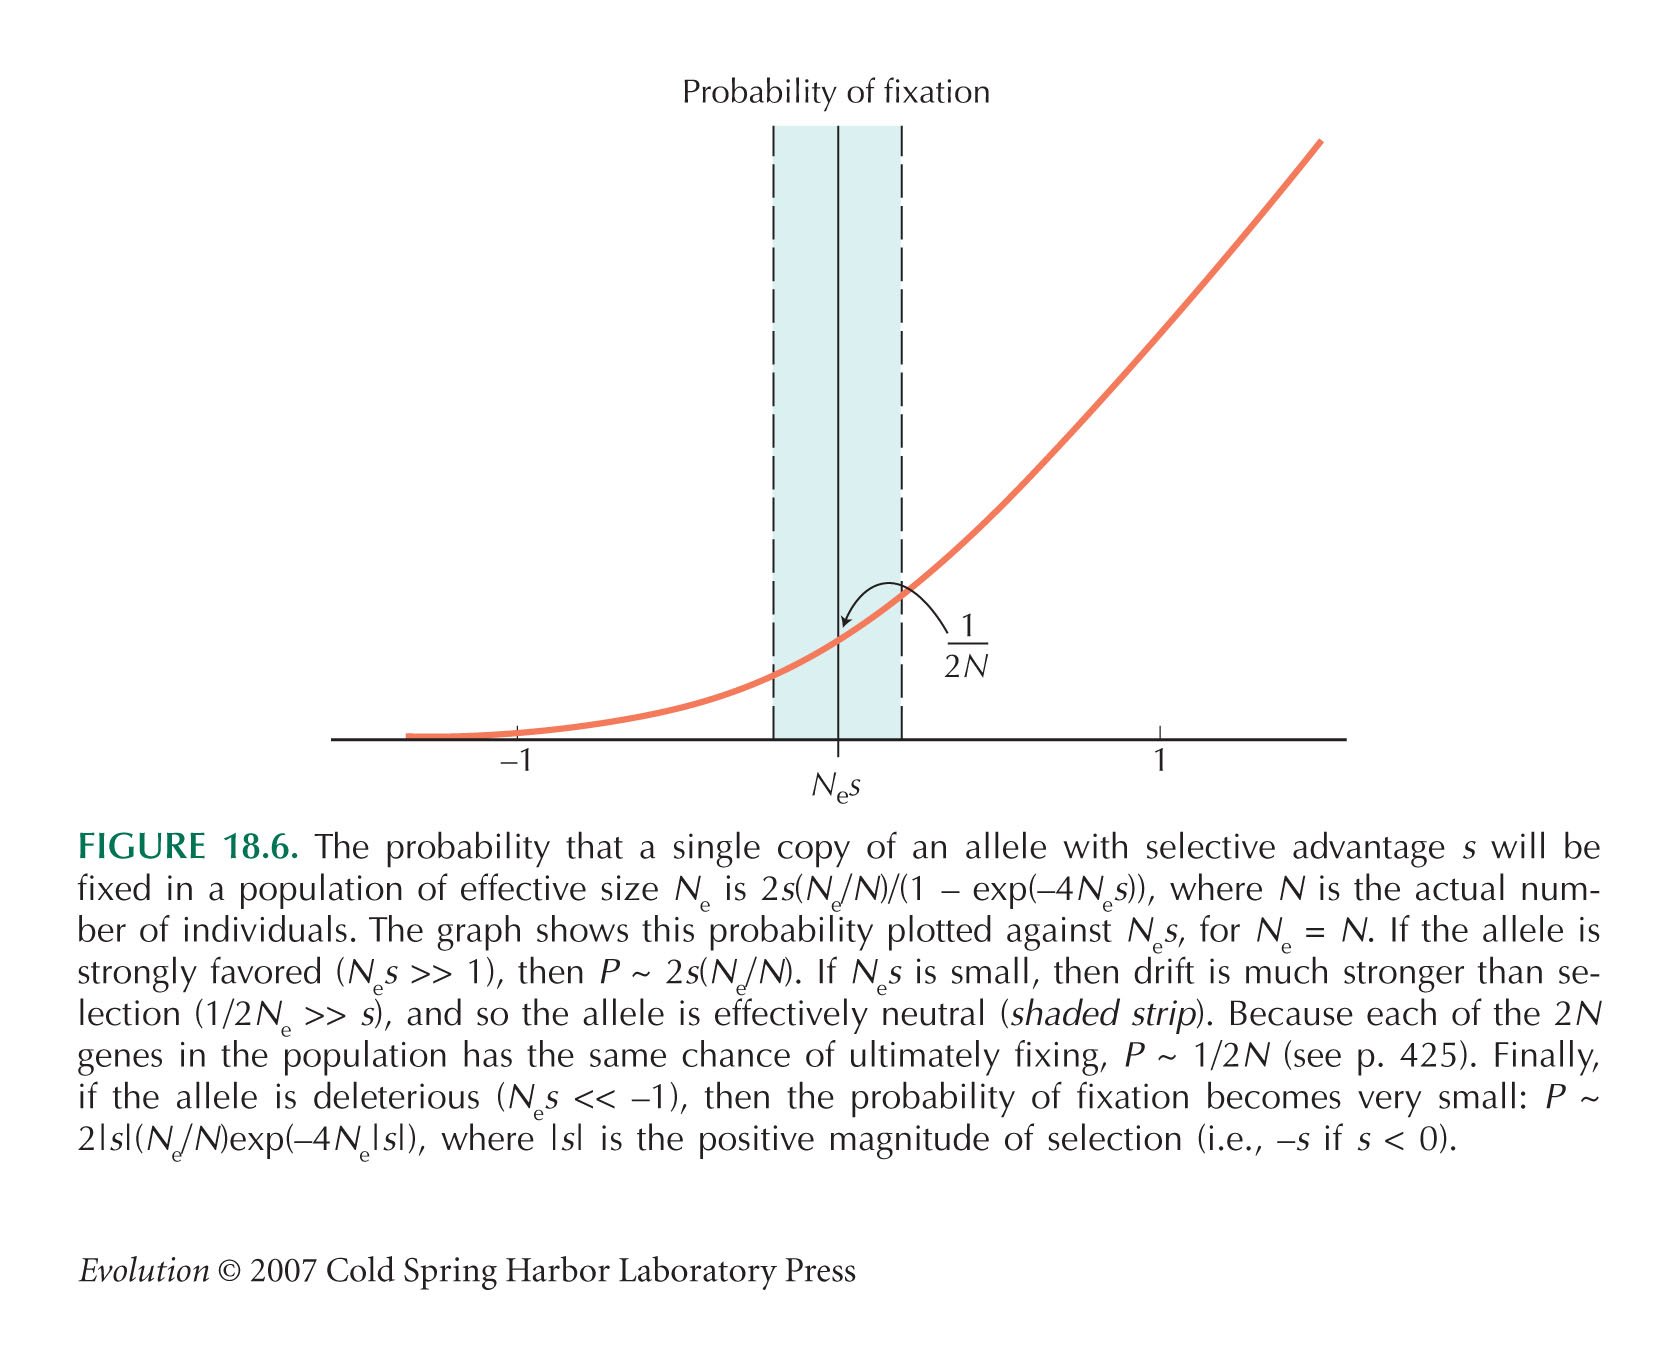
HINT 19W: Recall Figure 18.6.
HINT 19X: Once a pair has been disrupted, a second substitution will occur that restores pairing. This may take the pair back to the original state or it may produce a new pair.
HINT 19Y: The rate of back mutation to original state at one site is equal to the rate at which the other site in the pair mutates to produce a new pairing.
HINT 19Z: The number of heterozygous loci follows a binomial distribution; see Box 28.5.
HINT 19AA: Use the method of Box 28.2.
HINT 19BB: Use the same method as that in ii); see Table 17.1.
HINT 19CC: Assume that selection is weak, so that allele frequency changes continuously through time.
HINT 19DD: Ignore the effects of random drift. Then, the ratio of allele frequencies (p/q) is proportional to (1 + s)t ~ exp(st).
HINT 19EE: Because AU is not directly selected, its frequency within the genetic backgrounds defined by BP, BQ does not change as a result of selection.
HINT 19FF: We saw in iii) that selection does not change uP, uQ. So, we need only look at the change due to recombination at meiosis.
HINT 19GG: Combine the results from i)–iv).
HINT 19HH: An approximate answer will do here. Think about how strong the association uP – uQ will be at the time when BP gets to detectable frequency and sweeps to fixation.
HINT 19II: Average over the random positions at which these mutations arise. You can assume that the neutral gene is in the middle of the genome, R/2 from either end.