Random Drift of Quantitative Traits
We can write the value of a quantitative trait as the sum of effects of many genes, labeled i. For simplicity, suppose that there are two alleles of each gene (“+” and “–” at frequencies pi, qi). Each extra “+” allele at the ith gene increases the trait by αi. In a diploid, the contribution of the ith gene to the trait is 2αipi; the factor of 2 is needed because there are two copies of each gene. Overall, the trait mean is
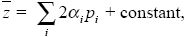
where the constant is just the trait value for an individual carrying all “–” alleles.
We need to know the additive genetic variance, VA, in terms of the allele frequencies pi and allelic effects αi. Each copy of the ith gene has a chance pi of contributing αi to the trait and a chance qi of contributing zero. The variance of such a two-valued distribution is  piqi (see Box 15.1 and Table 28.1), so the total genetic variance is piqi (see Box 15.1 and Table 28.1), so the total genetic variance is
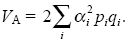
Again, there is a factor of 2 because the two copies of each gene both contribute to the variance.
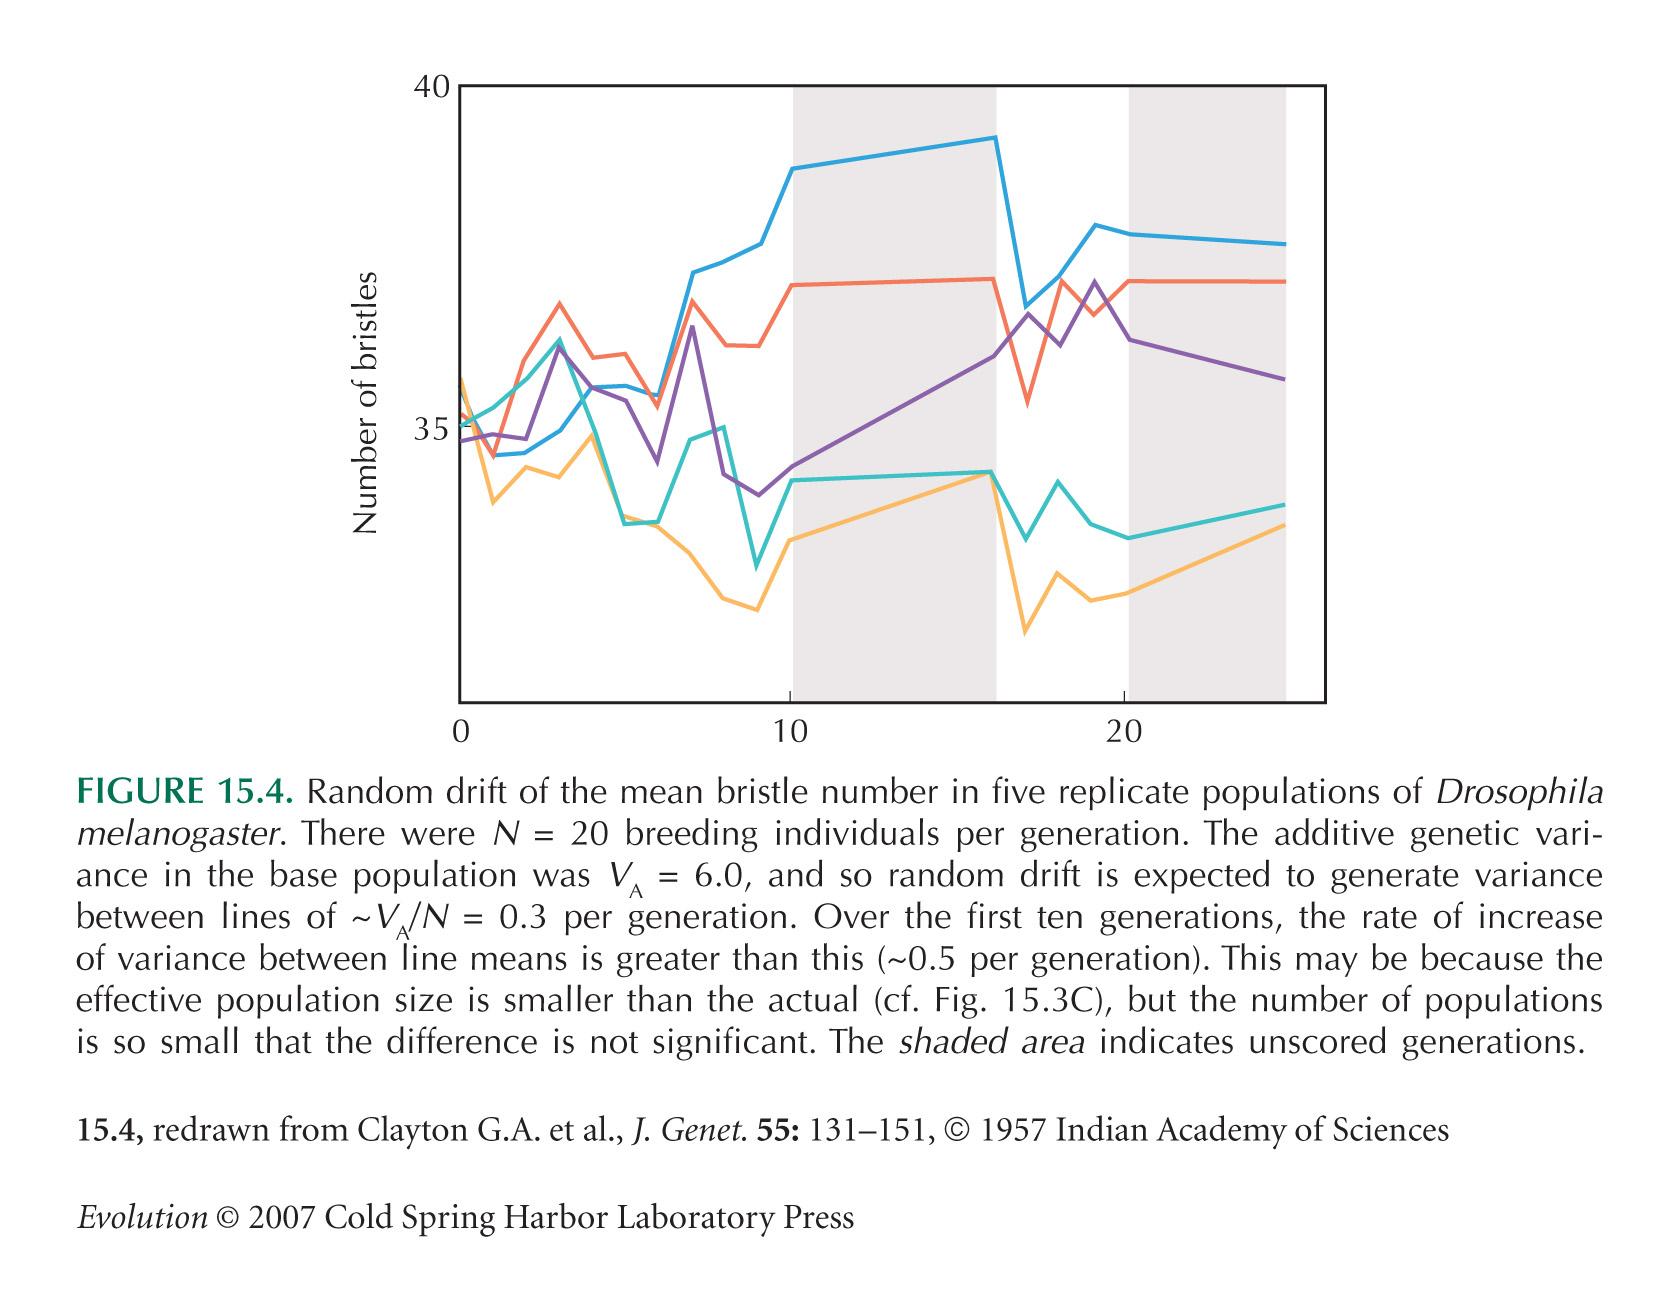
Now, we can use our knowledge of how random drift affects allele frequencies to find how it affects the mean and variance of a quantitative trait. On average, there is no change to the mean of the trait from one generation to the next (E[ t + 1] = E[t]), because there is no change in the average allele frequency. (This would not be true with dominance or epistasis, because random drift can cause inbreeding depression; see pp. 515–518.) However, the variance in allele frequency causes random variation in the trait mean, such as that seen in Figure 15.4. The variance in mean after one generation of drift is t + 1] = E[t]), because there is no change in the average allele frequency. (This would not be true with dominance or epistasis, because random drift can cause inbreeding depression; see pp. 515–518.) However, the variance in allele frequency causes random variation in the trait mean, such as that seen in Figure 15.4. The variance in mean after one generation of drift is
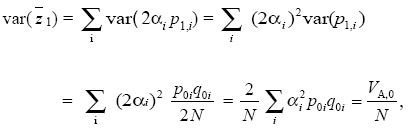
where p1,i is the allele frequency at gene i after one generation of drift. Random drift generates a variance in the trait mean equal to the additive genetic variance divided by population size. This relationship does not depend on the number of genes or their effects, αi. Thus, the effects of a drift on an additive trait can be predicted without knowing the detailed genetics.
Random drift reduces genetic diversity within populations and so, on average, the additive genetic variance should decrease. The additive variance is proportional to the product of allele frequencies, and we saw in Box 15.1 that this decreases as the variance of allele frequency increases. Thus, after one generation,
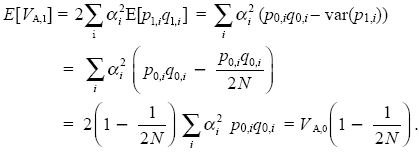
On average, the genetic variance decreases by a factor (1 – 1/2N) in every generation. Therefore, using (1 – x)t ~ exp(xt) for x << 1 (Chapter 28), we see that VA,t ~ VA,0 exp(–t/2N). This is exactly the same pattern as for the decline in average heterozygosity, E[2pq] (Box 15.1). After 2N generations, random drift will have reduced additive genetic variance by a factor e–1 ~ 37%.
|


