Figure WN19.3.
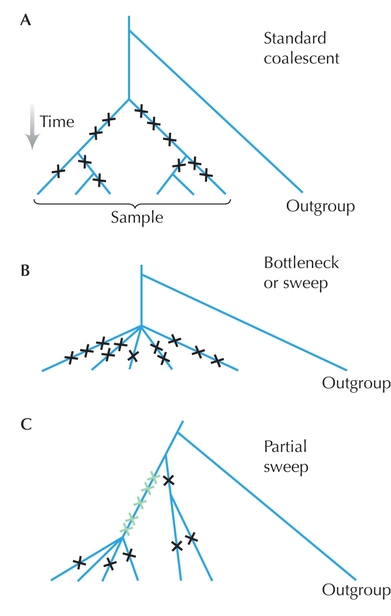
Deviations from the standard model of neutral evolution can be detected by comparing different measures of genetic diversity. In each of these diagrams, there is a sample of 6 genes, which includes 11 segregating variants (crosses). This gives an estimate of θW = 11 / ![]() = 4.82 (A) The average number of pairwise differences is θπ = 5.4. These estimates of diversity are similar; this example is typical of the standard neutral coalescent. (B) A severe bottleneck or selective sweep leads to a “star” genealogy, with an excess of rare variants. Here, θπ = 2.67, and so Tajima’s D = (θπ – θW)/s.d. is negative. (C) In this example, a partial selective sweep has raised five variants to high frequency (green). θπ = 3.6, so that Tajima’s D is weakly positive. Fay and Wu’s (2000) measure of diversity, which gives greatest weight to derived variants at high frequency, is θH = 8.93. Hence, their H statistic is strongly positive, indicating a partial selective sweep.
= 4.82 (A) The average number of pairwise differences is θπ = 5.4. These estimates of diversity are similar; this example is typical of the standard neutral coalescent. (B) A severe bottleneck or selective sweep leads to a “star” genealogy, with an excess of rare variants. Here, θπ = 2.67, and so Tajima’s D = (θπ – θW)/s.d. is negative. (C) In this example, a partial selective sweep has raised five variants to high frequency (green). θπ = 3.6, so that Tajima’s D is weakly positive. Fay and Wu’s (2000) measure of diversity, which gives greatest weight to derived variants at high frequency, is θH = 8.93. Hence, their H statistic is strongly positive, indicating a partial selective sweep.
| © 2007-2010 by Cold Spring Harbor Laboratory Press. All rights reserved. |
| The reproduction, modification, storage in a retrieval system, or retransmission, in any form or by any means, electronic, mechanical, or otherwise, for reasons other than personal, noncommercial use is strictly prohibited without prior written permission. You are authorized to download one copy of the material on this Web site for personal, noncommercial use only. The material made available on this Web site is protected by United States copyright laws and is provided solely for the use of instructors in teaching their courses and assessing student learning. Dissemination or sale of any of this material, as a whole or in parts (including on the World Wide Web), is not permitted. All users of these materials and visitors to this Web site are expected to abide by these restrictions. Requests for permission for other uses of this material should be directed to Cold Spring Harbor Laboratory Press, 1 Bungtown Road, Cold Spring Harbor, NY 11724 or submitted via our World Wide Web Site at http://www.cshlpress.com/. |