Chapter 19 Notes
Measuring Selection
Direct Measurement of Selection
Measuring Selection Directly Is Difficult
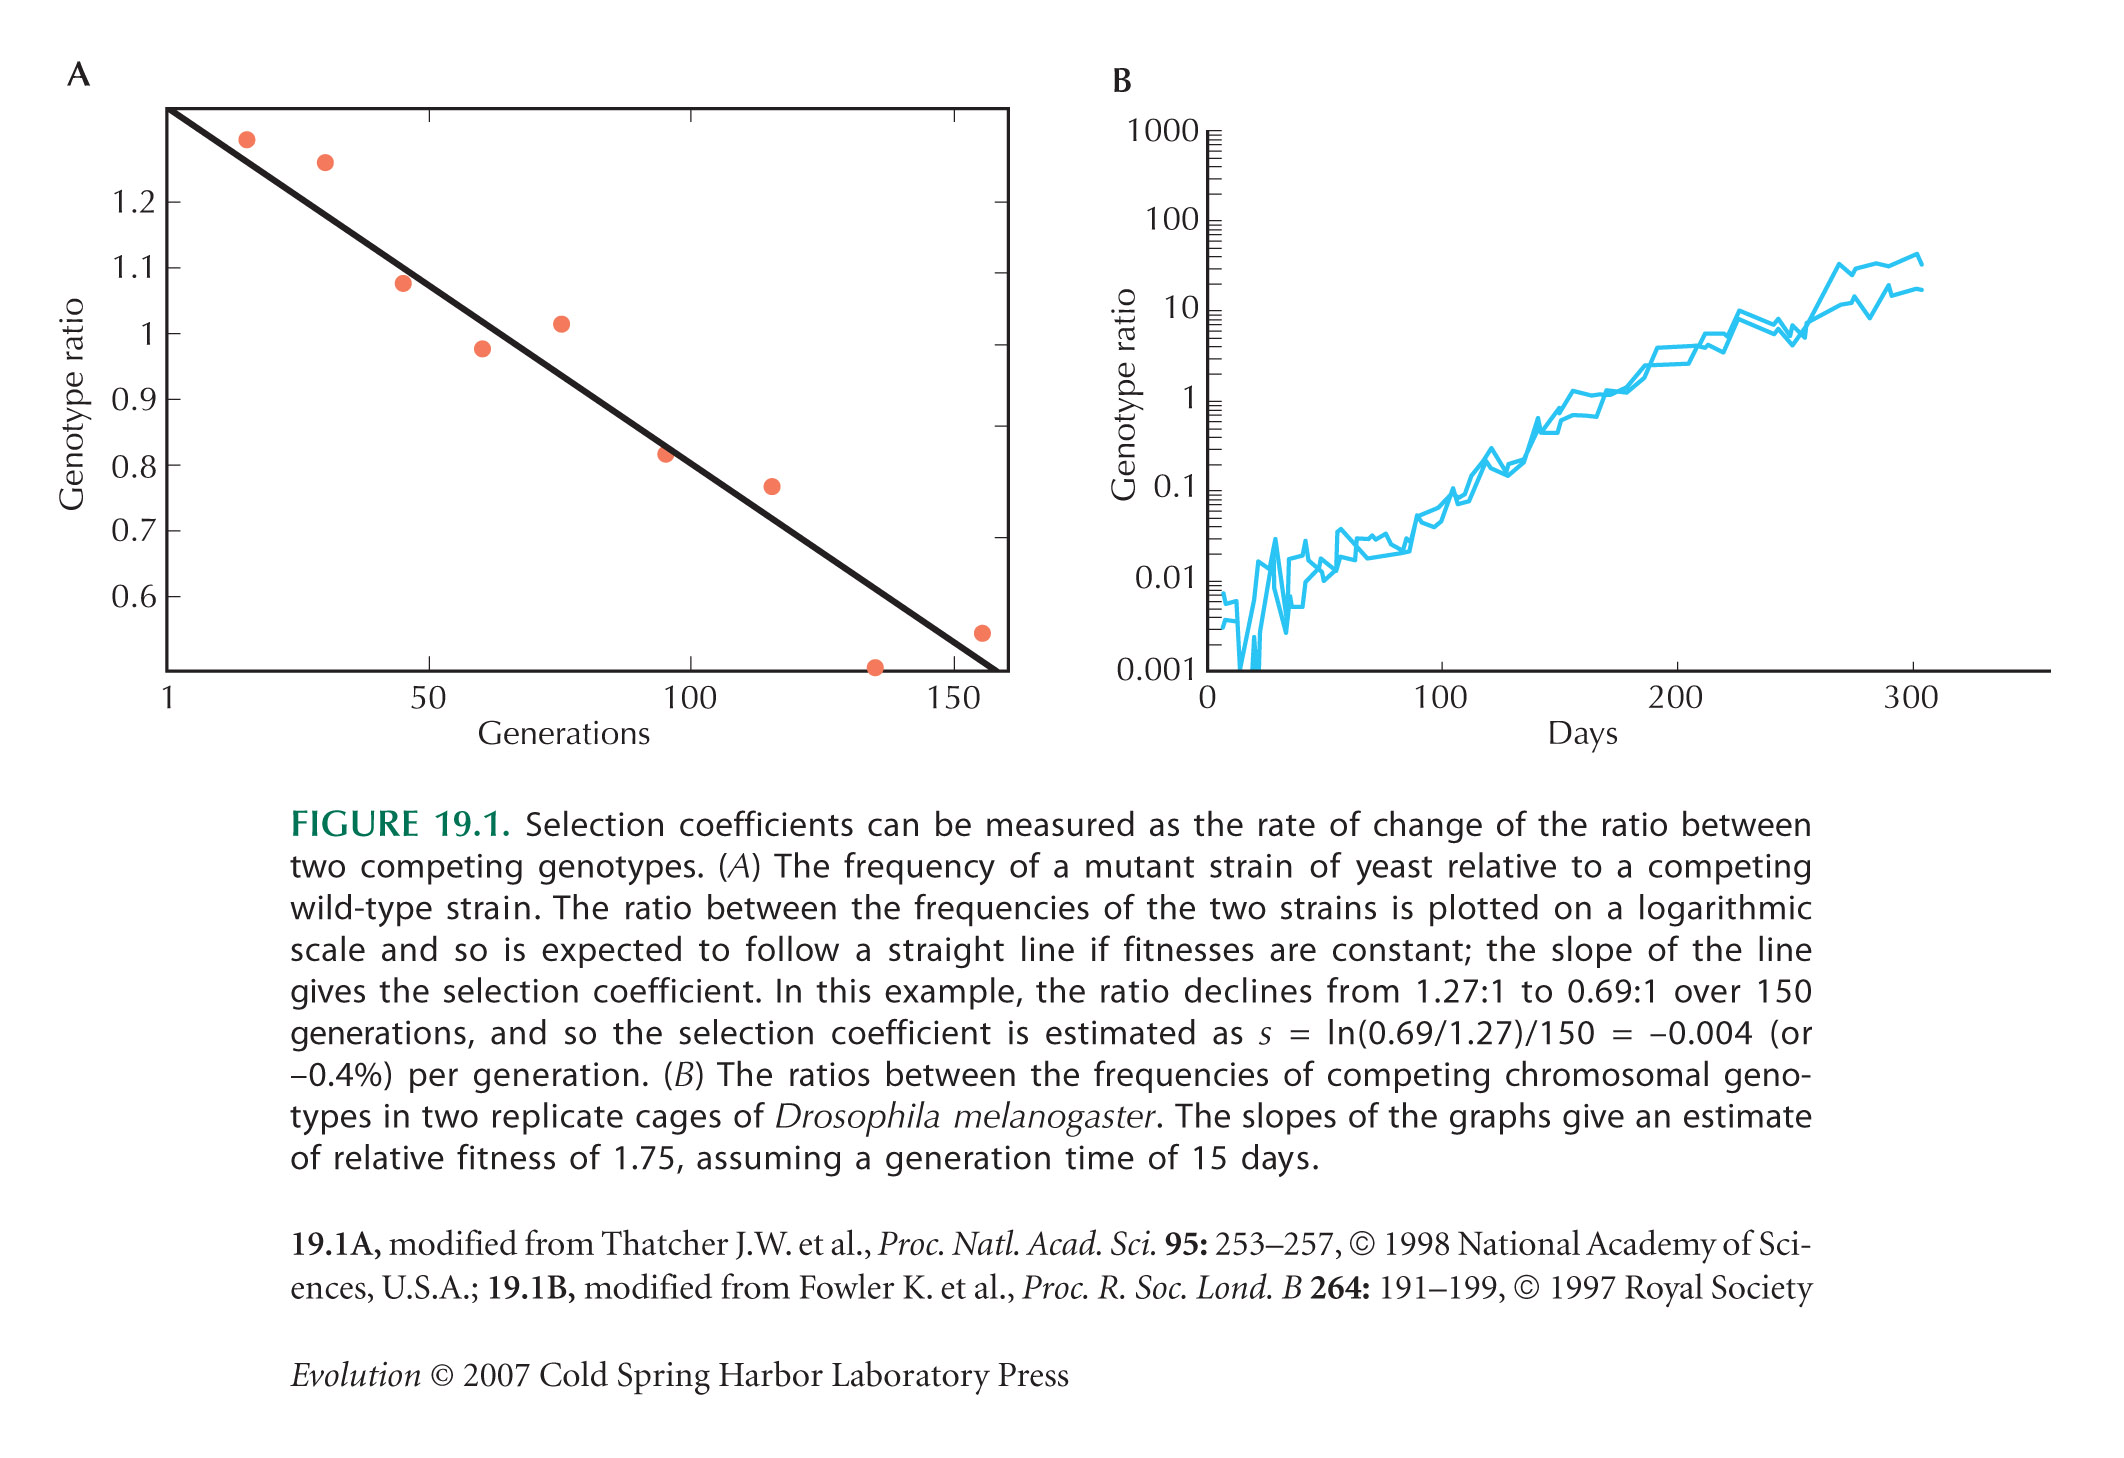
Figure 19.1A is from Thatcher et al. (1998). Figure 19.1B is from Fowler et al. (1997).
Rozen et al. (2003) survey the fitness effects of beneficial mutations that arose in a laboratory population of Escherichia coli. They find a distribution of effects that has a mode at s ~ 10% per generation.
Genetic Manipulation Is Needed to Find the Effect of a Specific Genetic Difference
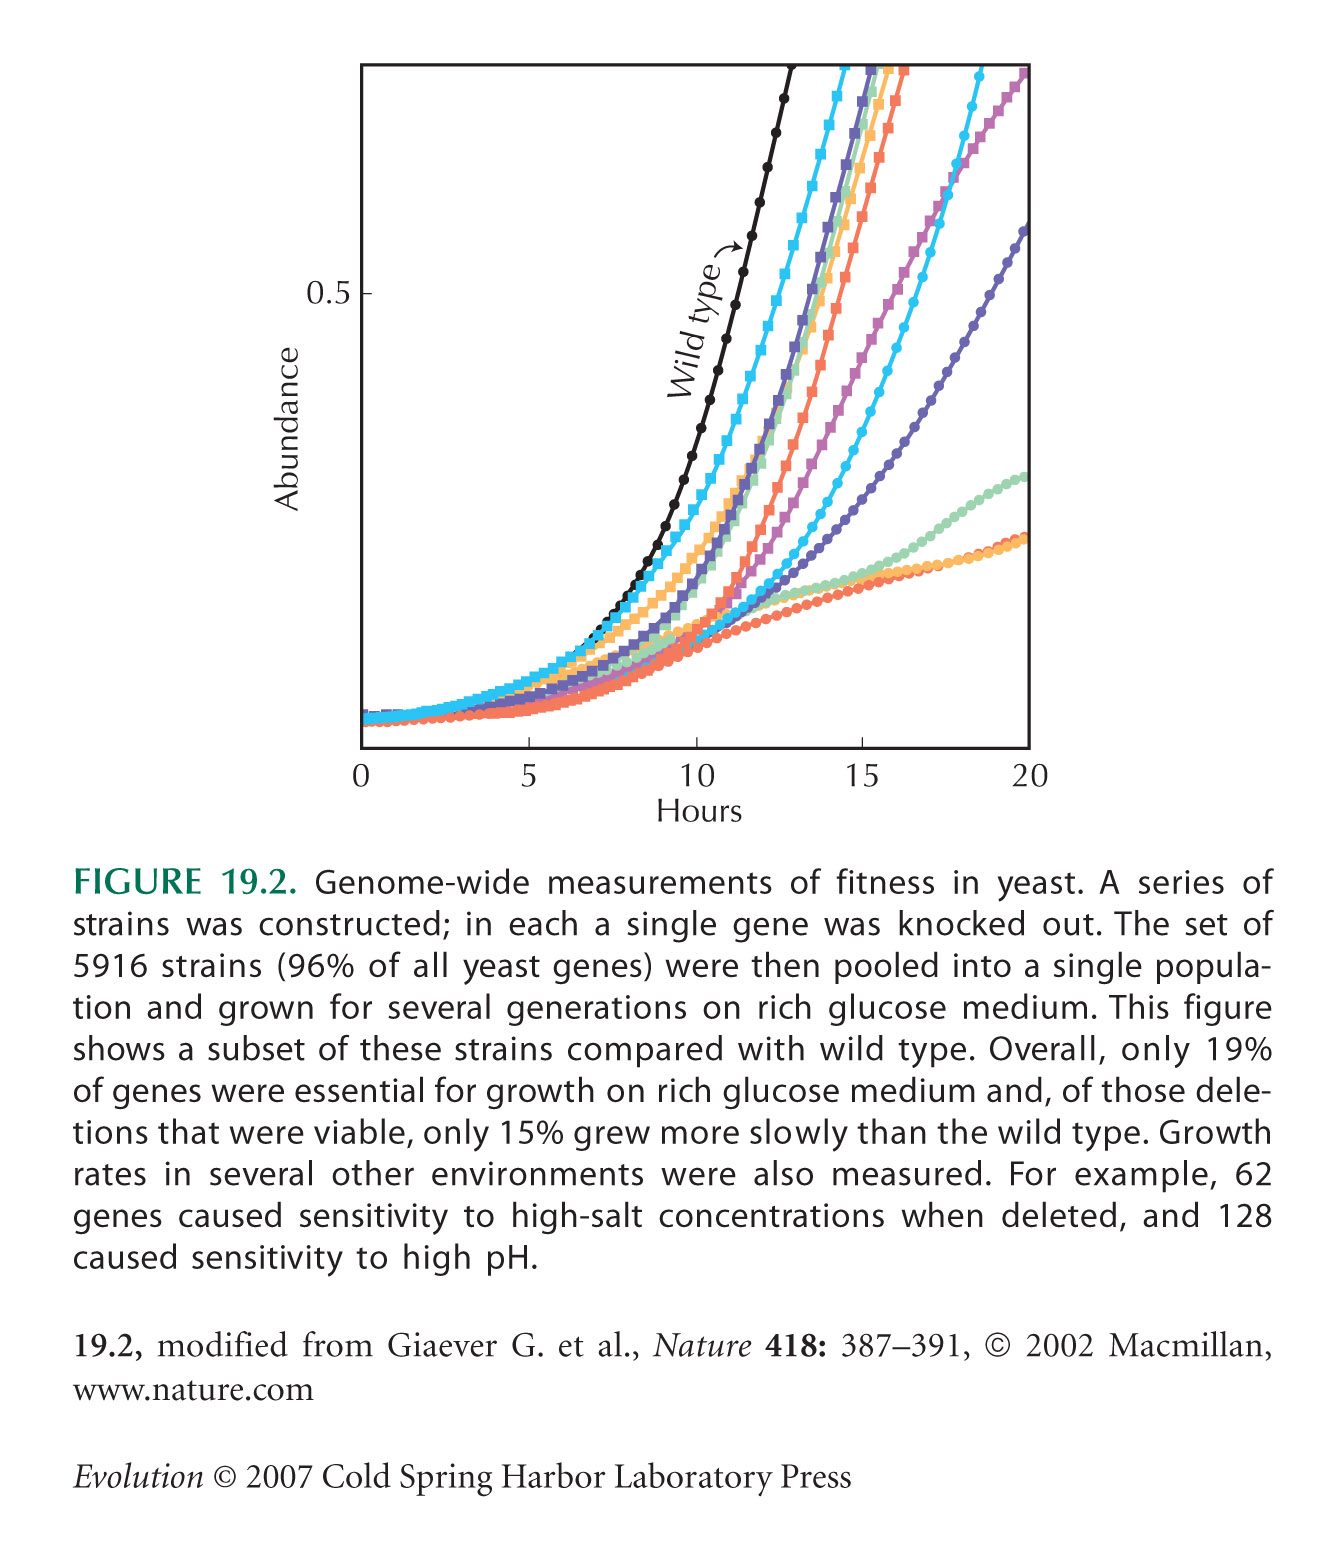
Figure 19.2 is from Giaever et al. (2002).
Selection Can Be Measured by Correlating Fitness Differences with Genetic Variation
Figure 19.3A is from Van Delden et al. (1978). Figure 19.3B is from Berry and Kreitman (1993). Evidence for selection on Adh is reviewed by Van Delden (1982), Laurie-Ahlberg (1985), and Chambers (1988).
Polymorphism at PGI in Colias butterflies is reviewed by Watt and Dean (2000). LDH polymorphism in Fundulus is reviewed by Powers et al. (1993).
Enzyme Variation Is Often Selected
Figure 19.5 is from Rosenzweig et al. (1994).
The survey of the first published polymorphisms in Drosophila melanogaster is made by Gillespie (1991, Table 1.3).
The study of enzyme loci in chemostat populations of E. coli is discussed by Hartl (1989) and Dykhuizen (1990); see also Dean (1989, 1995).
Selection Can Be Measured by Correlating Quantitative Traits with Fitness
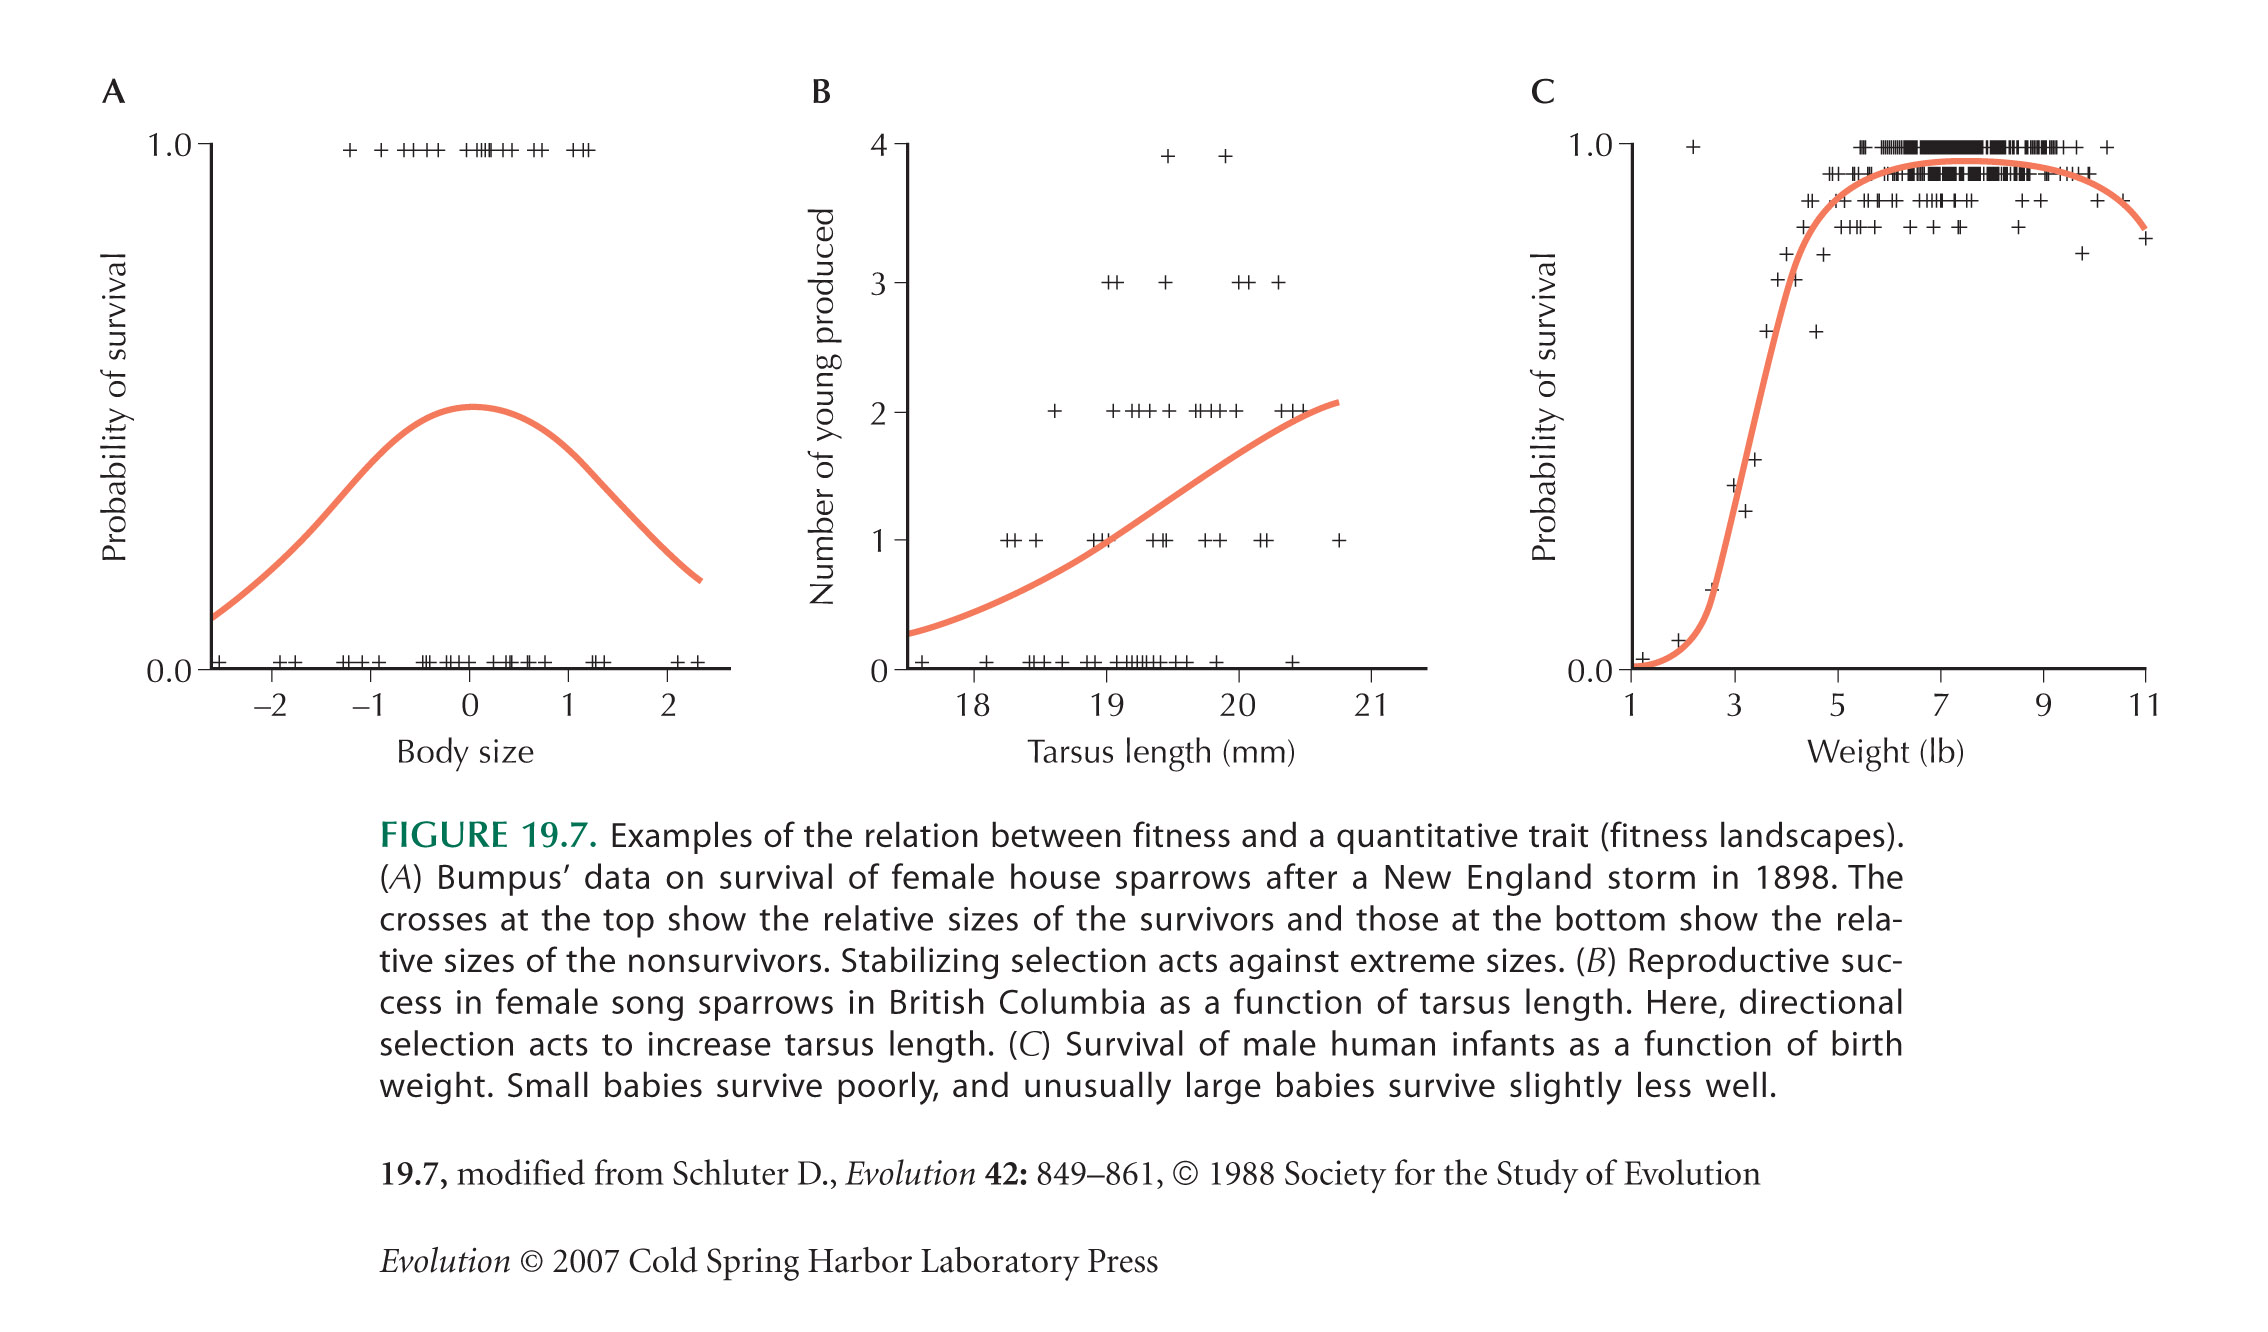
The first measurement of selection on a quantitative trait was by Bumpus (1899). These data were discussed by Johnston et al. (1972) and reanalyzed by O’Donald (1973).
Endler (1986) extensively reviews “natural selection in the wild.”
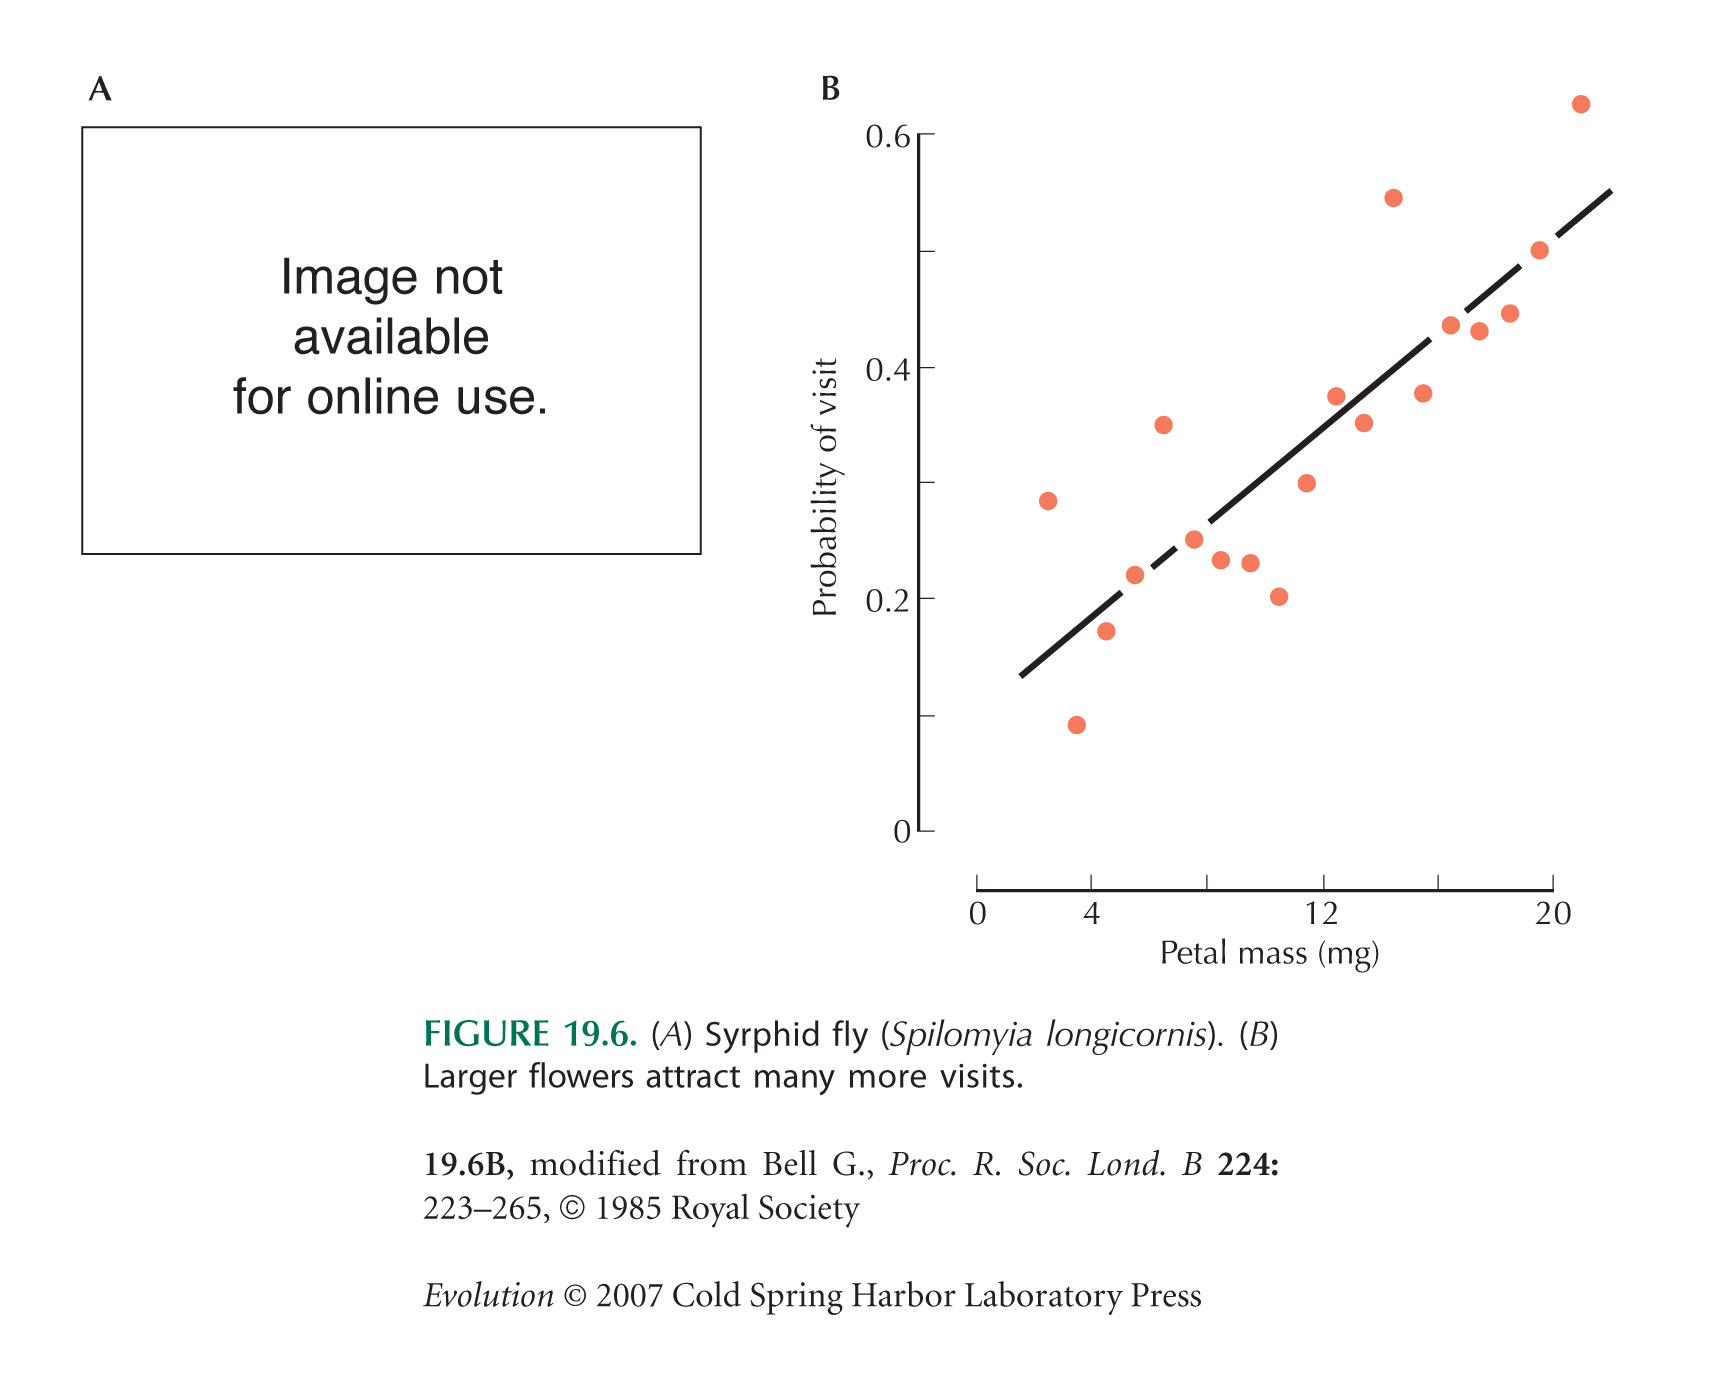
Figure 19.6B is from Bell (1985). Vivid floral displays attract pollinators, thus ensuring that the ovule is pollinated and also exporting pollen to fertilize other plants. Bell (1985) showed that flowers function primarily to export pollen (and, hence, increase the male component of fitness); much smaller flowers would suffice to ensure that the ovule is fertilized. Sexual selection in plants is discussed further on pages 573–584.
Selection on a Correlated Trait Can Cause Apparent Selection on the Trait Being Measured
The example in which stabilizing selection on bristle number acts via larval viability is from Barnes and Kearsey (1970) and Kearsey and Barnes (1970).
Barton (1990) and Kondrashov and Turelli (1992) discuss how apparent stabilizing selection on a trait can be caused by pleiotropic effects of the underlying genes.
The red deer example of Figure 19.8, showing stasis despite apparently strong selection, is from Kruuk et al. (2002). For a broader review of this issue, see Merila et al. (2001).
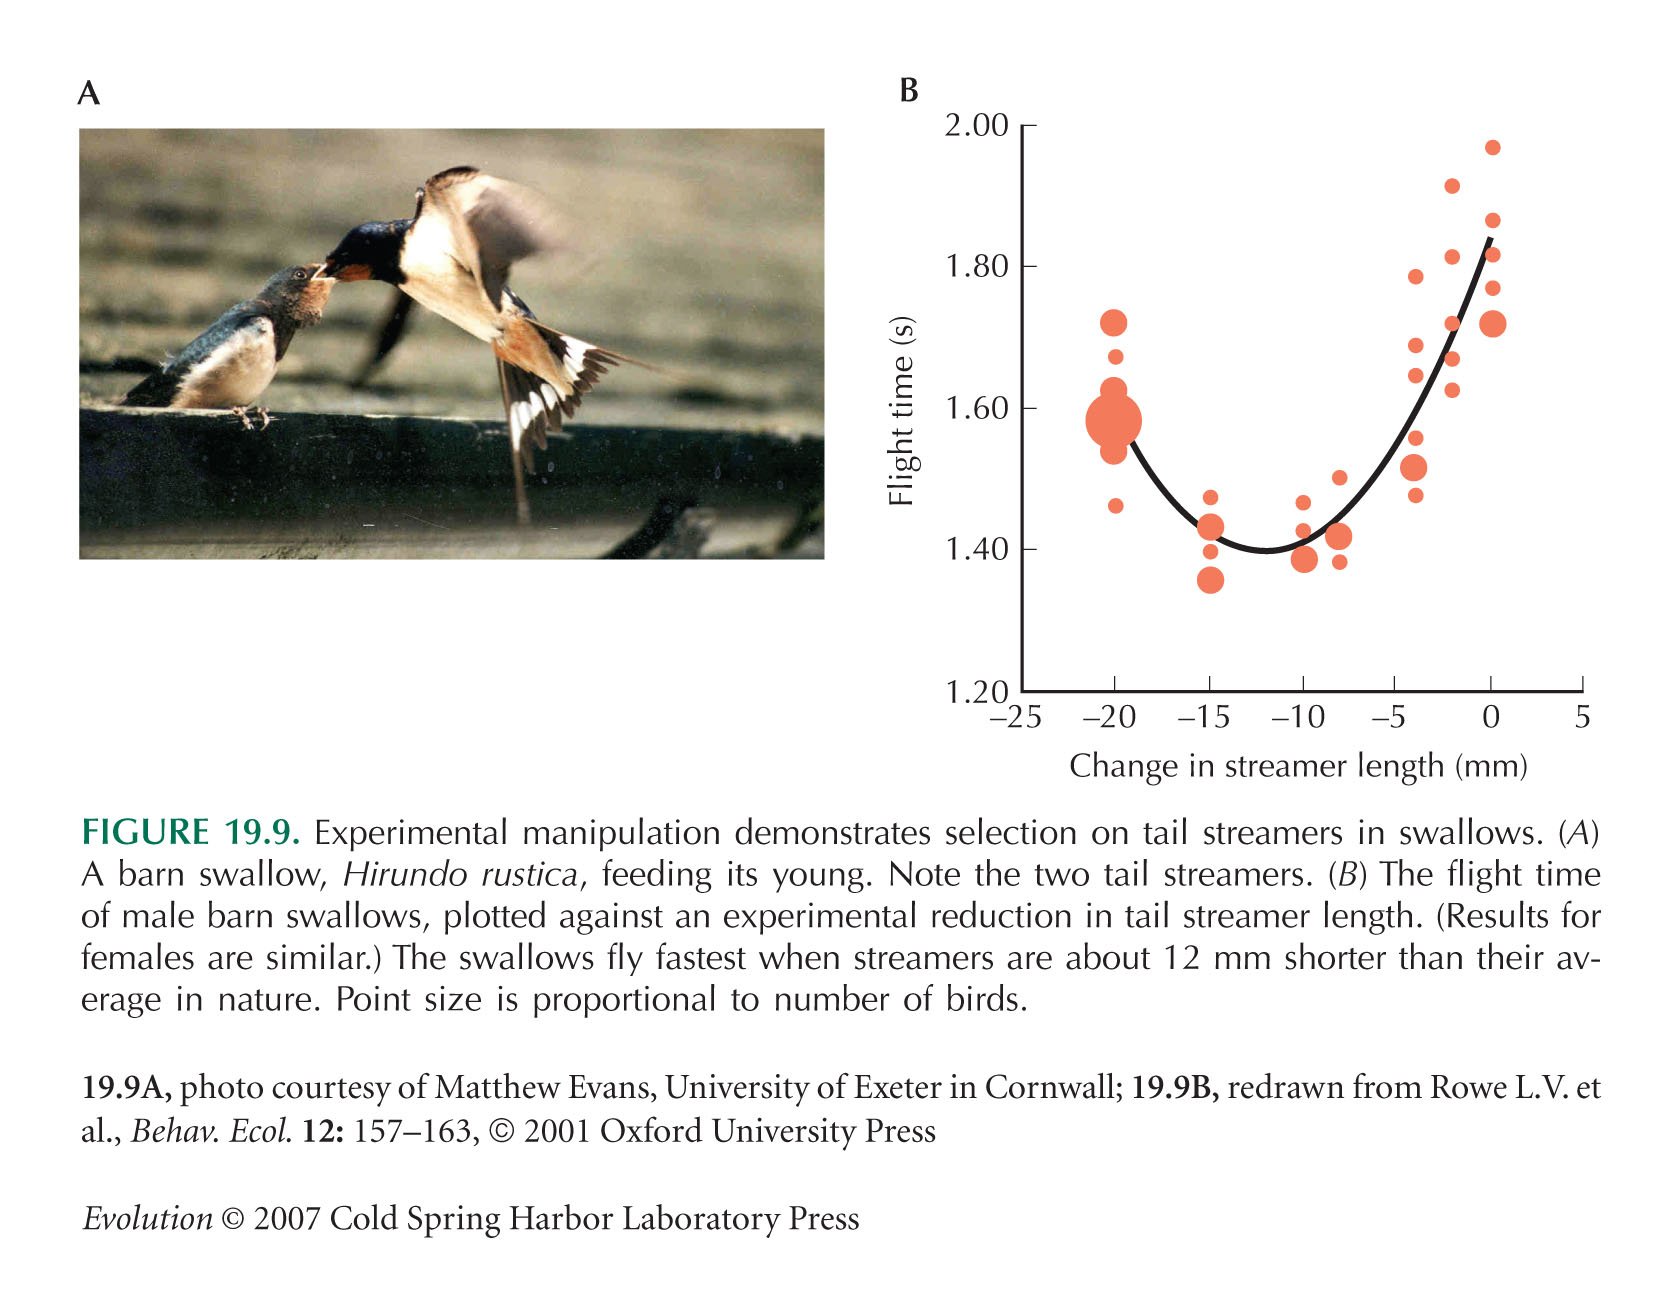
Manipulations of swallow tail streamers (Fig. 19.9B) are from Rowe et al. (2001).
Lande and Arnold (1983) introduced the for identifying the target of selection among a set of correlated traits. This approach is close to the early research program of Pearson and Weldon (p. 21), who also measured selection on sets of correlated traits (e.g., see Fig. 1.23). See, for example, Pearson (1903).
Quantitative Traits Are Often Subject to Natural Selection
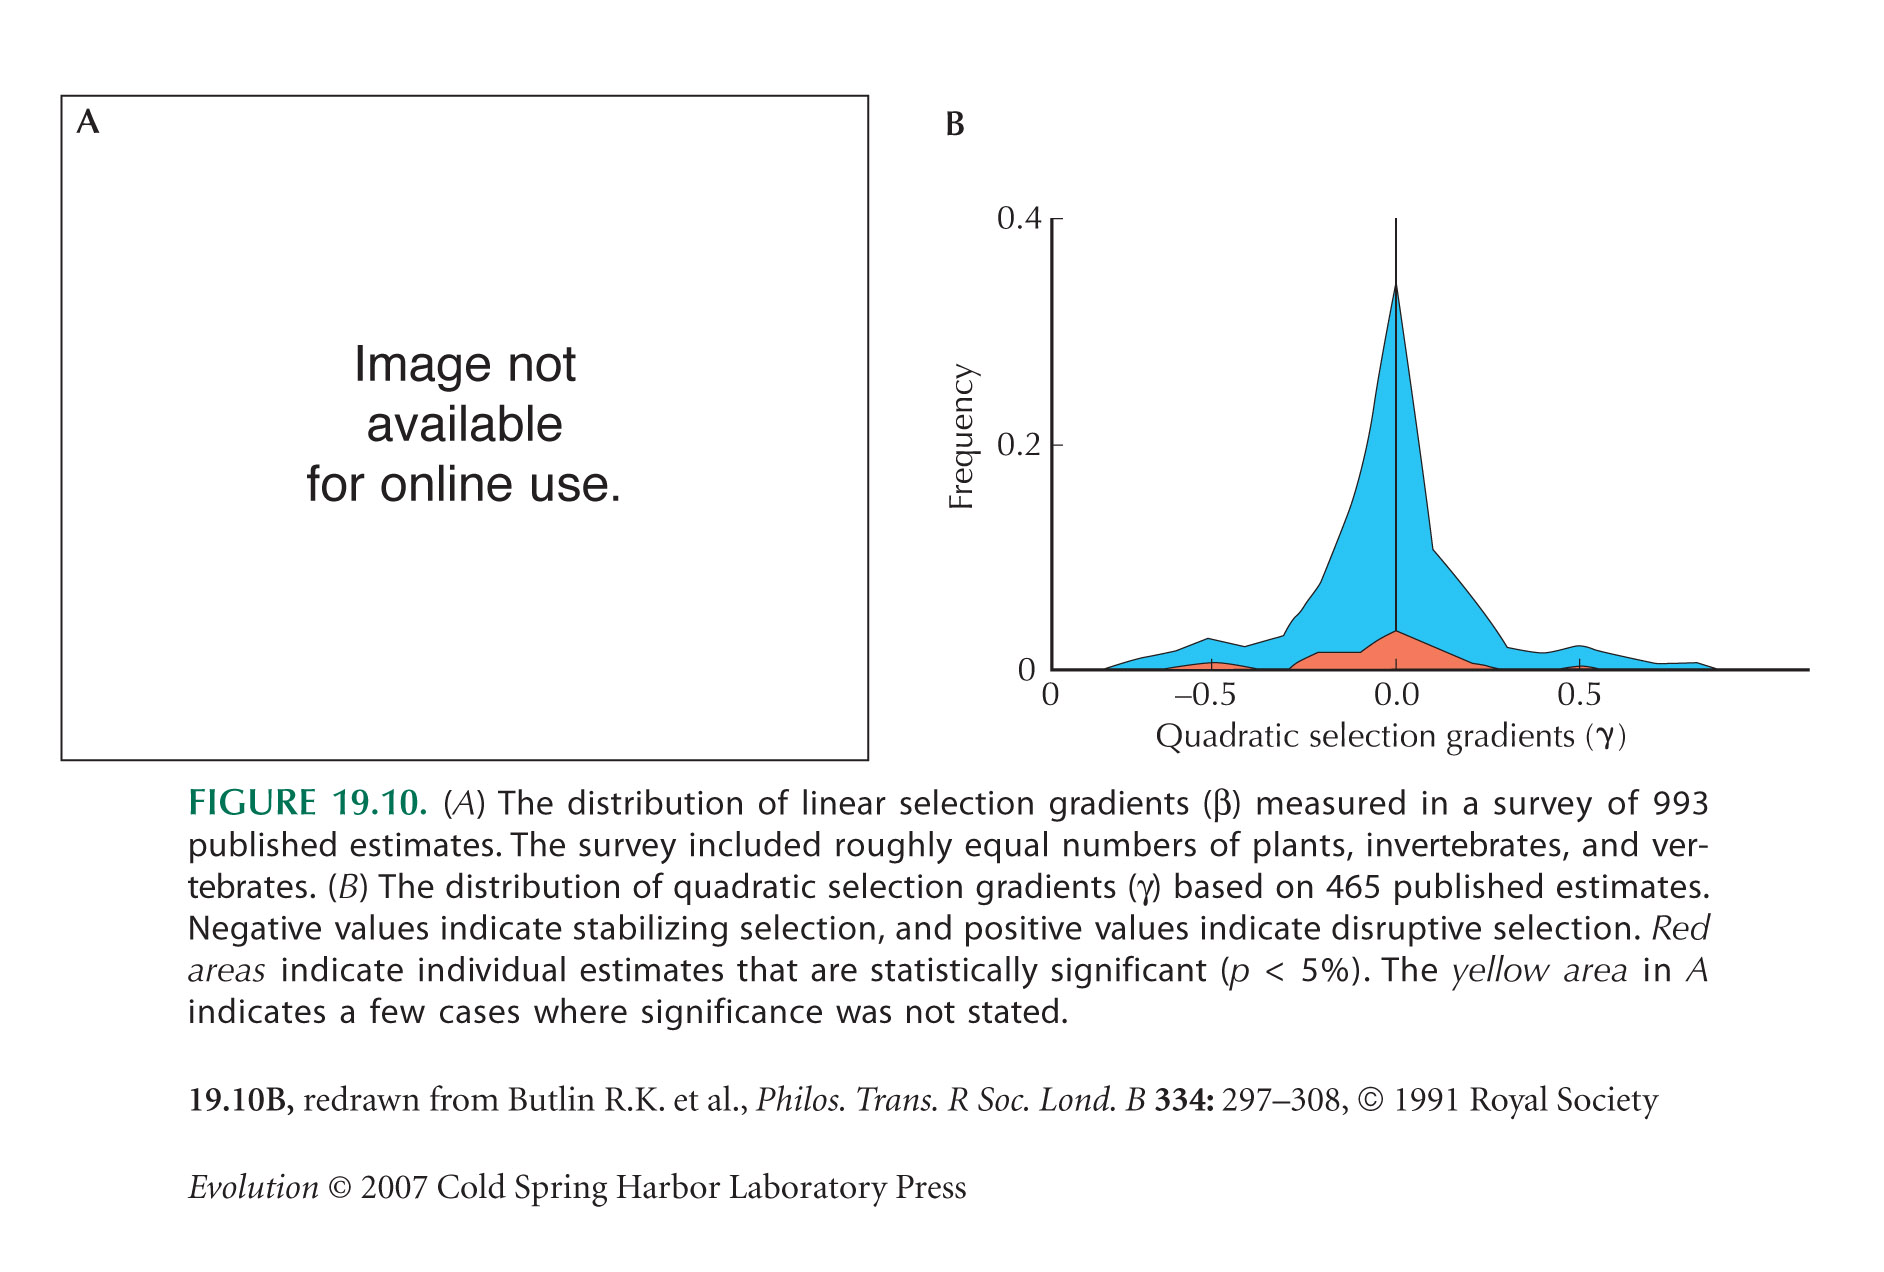
Endler (1986) compiled a review of measurements of “natural selection in the wild,” which suggested surprisingly strong selection. Kingsolver et al. (2001) survey many more studies, which suggest a skewed distribution of selection strength (most weak, some strong) and also an upward publication bias (Fig. 19.10). Morjan and Rieseberg (2004) and Rieseberg et al. (2003) compile a still larger survey and bring estimates of selection gradients together with estimates of quantitative trait locus (QTL) effect sizes to find the strength of selection on an individual QTL. Hereford et al. (2004) review estimates of the selection gradient, standardized by the trait mean, and discuss why estimates are remarkably high.
If disruptive selection were as widespread as is suggested by Figure 19.10B, populations would be unstable. They would either evolve rapidly to one or another extreme, maintain very high levels of genetic variation, or split into distinct species (see pp. 650–653). However, much of the scatter in Figure 19.10B may be random sampling error; extremely large studies are needed to get accurate estimates of γ. In addition, γ is estimated by fitting a quadratic curve to the data. If the actual relationship between fitness and trait has a more complicated shape, then disruptive selection may be estimated even if selection is purely directional. (For example, the pattern in Fig. 19.7B yields a positive estimate of γ [see Schluter 1988].) Finally, all of these estimates are for components of fitness, rather than fitness itself; they usually measure survival or mating success over a brief period. Selection is likely to fluctuate over time and over different stages of the life cycle, and so we do not know whether in the long run it acts to increase or decrease the variance of a trait. (Recall the large fluctuations in selection on beak shape in the Galapágos finches [Fig. 17.25].)
Orr (1998) devised an ingenious test for selection on quantitative traits, based on the sign of effects of the underlying QTL. If divergence has been neutral, then one expects that it will be due to QTL with a mixture of positive and negative effects. In contrast, if directional selection has acted, increase in the trait will be due to QTL with predominantly positive effects. Rieseberg et al. (2003) review applications of this test, which gives evidence for widespread selection.
The evidence for selection discussed in this chapter is all from present-day population. Bell et al. (2006) use an exceptionally detailed series of stickleback fossils to show that directional selection has acted on their defensive armor. See Hendry (2008) for a commentary.
Indirect Measurement
Selection Can Be Measured Indirectly through Its Interaction with Other Forces
The estimates of weak selection against nulls in D. melanogaster was by Langley et al. (1981). Note that only one of the 20 loci surveyed gave nulls that were lethal when made homozygous. One possible problem with this survey is that alleles that do not function under the conditions of the electrophoretic assay may still function in vivo.
The strength of selection can be estimated from in the grasshopper Chorthippus parallelus (Butlin et al. 1991).
Barton and Hewitt (1985) and Barton and Gale (1993) discuss how selection can be estimated from cline width.
Selection can also be detected by looking for markers that show excessive variation from place to place, as measured by FST. See Chapter 16 Web Notes.
Deviations from the Molecular Clock Indicate Selection
Figure 19.11 is from Kimura (1983, Chapter 4.2). Gillespie (1991, Chapter 3.5) has argued most strongly that variation in the rate of the molecular clock implies that selection causes bursts of substitutions.
Smith and Eyre-Walker (2003) partition variation in rate into effects of gene, lineage, and gene-by-lineage interaction. It is the latter that gives evidence for deviations from neutrality (i.e., variation in rates between genes, after lineage-specific effects have been taken out). Smith and Eyre-Walker find significant gene-by-lineage interactions for amino acid substitutions, but not for synonymous variation. This supports Gillespie’s arguments against the neutral theory.
Gillespie (1991, pp. 30–32) gives a detailed account of the lysozyme example of Figure 19.12.
A High Rate of Amino Acid Evolution Relative to Synonymous Change Indicates Positive Selection: Ka/Ks
Figure 19.13 is from Yang et al. (2000). Methods for estimating excess rates of amino acid substitution are reviewed by Yang and Bielawski (2000).
Swanson (2003) reviews recent examples of high rates of amino acid evolution.
The Pattern of Variation within Populations Can Reveal Deviations from the Neutral Theory
Figure 19.14 is from Ward and Beardmore (1977), discussed by Kimura (1983, Chapter 8.2). Observed frequencies are compared with the distribution predicted by the neutral theory, on the assumptions that every mutation produces a new allele (i.e., the infinite-alleles model), and assuming the same neutral mutation rate at all genes (blue columns in Fig. 19.14). The latter assumption is highly implausible, since these genes vary in degree of selective constraint and in size. However, allowing for variation between them makes rather little difference to the distribution (black columns in Fig. 19.14).
In the Xanthine dehydrogenase example, Ewens’ (1972) sampling formula was applied. See Coyne (1982).
Ohta has been primarily responsible for developing the extension to the neutral theory, in which slightly deleterious alleles segregate at low frequency within populations, and occasionally are fixed by chance (Box 18.1). For reviews, see Ohta and Gillespie (1996) and Ohta (1996, 2002).
Charlesworth and Eyre-Walker (2007) give evidence for the slightly advantageous back-mutations that are required to compensate for fixation of slightly deleterious mutations.
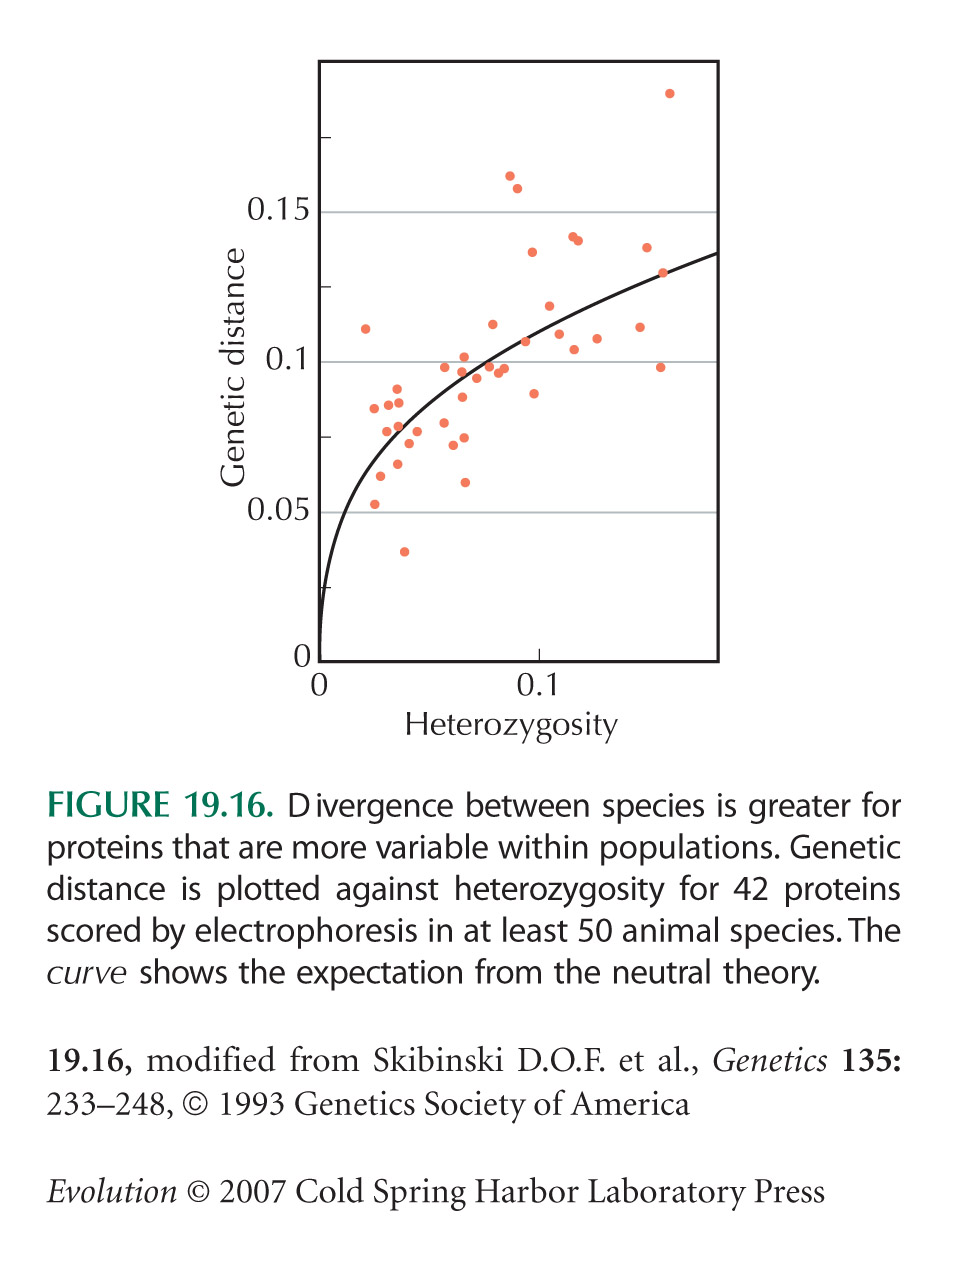
Under the Neutral Theory, Polymorphism within Species Should Be Proportional to Divergence between Species
The survey of Figure 19.16 is from Skibinski et al. (1993).
Smith and Eyre-Walker (2002) and Fay et al. (2001) applied the McDonald–Kreitman test across large numbers of genes.
The figure of 13,600 for gene number in D. melanogaster is that used by Smith and Eyre-Walker (2002) and is taken from the first publication of the genome sequence of D. melanogaster (Adams et al. 2000). Because it is difficult to identify genes simply by examining the sequence, this figure is still uncertain. Hild et al. (2003) estimate 17,000 genes; Yandell et al. (2005) reevaluate these genes and come to a more widely accepted estimate of about 14,000, which is not much higher than the earlier estimate (C. Bergman, pers. comm.).
In the McDonald–Kreitman test, divergence between species is compared with polymorphism within them. We can also compare divergence between populations within species with polymorphism within them, using the statistics FST and QST. For examples where this approach is used to detect selection, see Chapter 16 Web Notes.
For more on the test described in Box 19.1, see McDonald and Kreitman (1991).
Selection on Linked Loci
Selection Can Be Detected through Its Effects on Linked Neutral Variation
The Duffy example is from Hamblin and Di Rienzo (2000) and Hamblin et al. (2002).
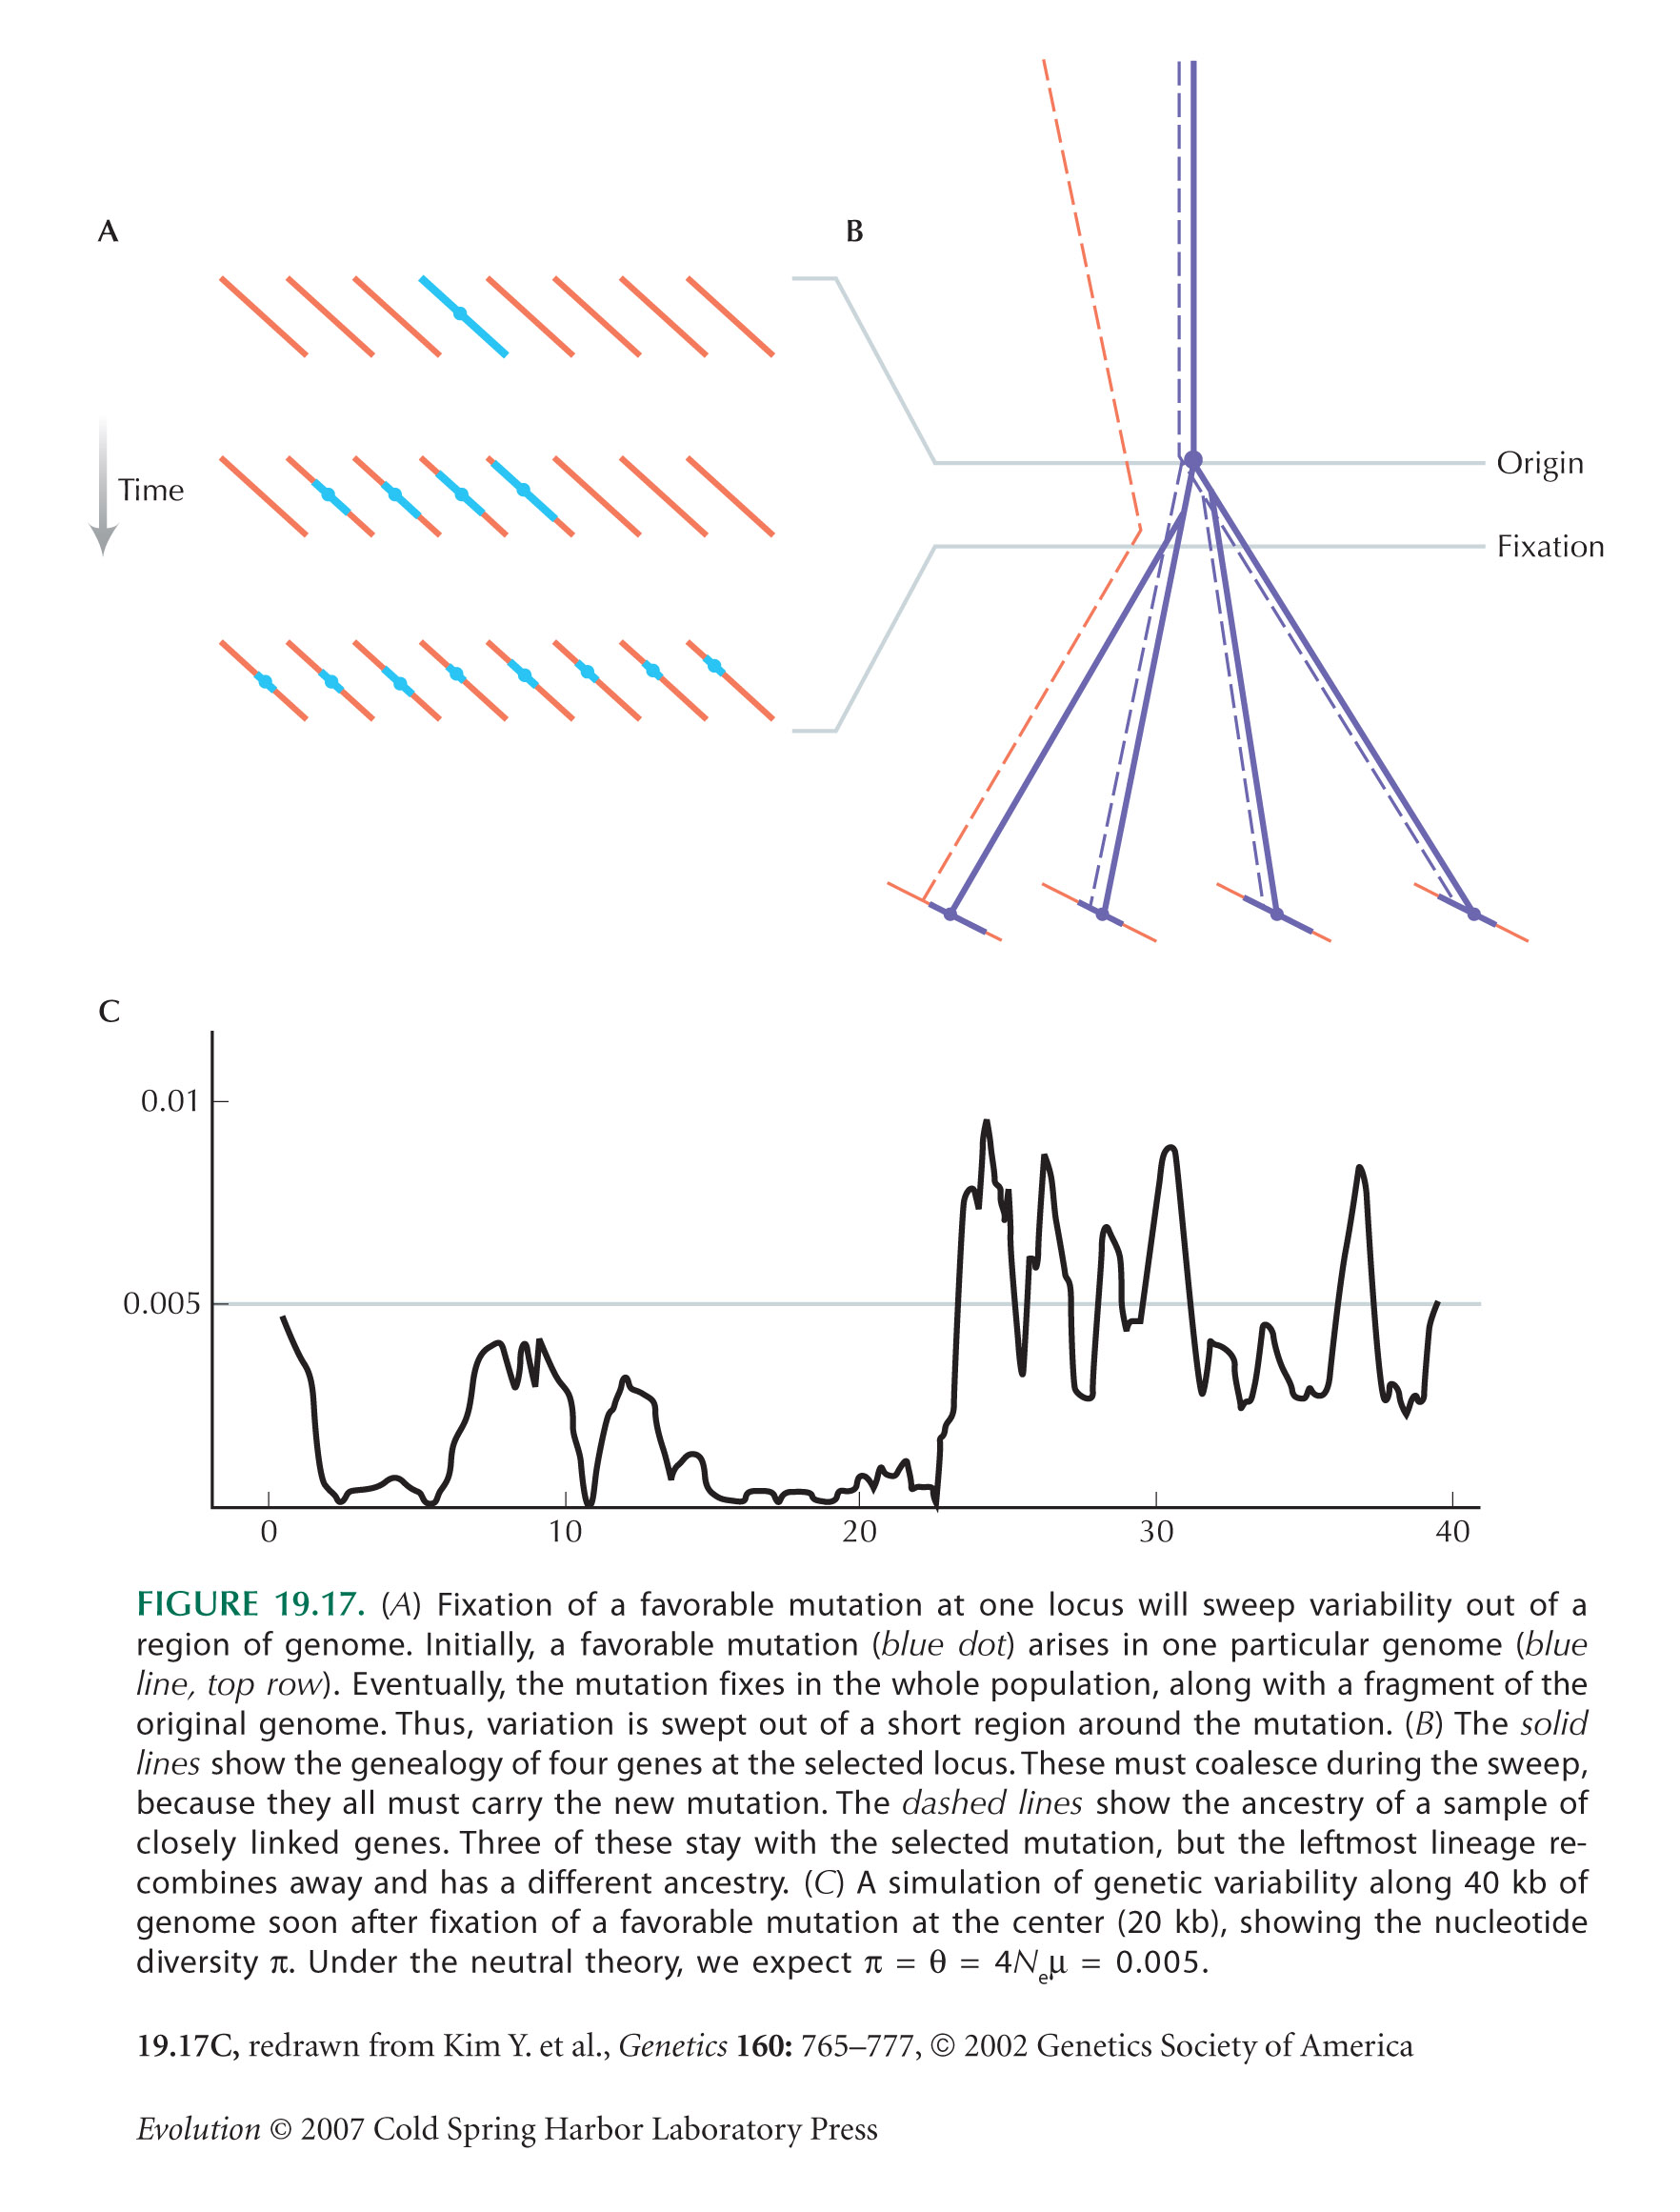
Selective Sweeps Cause a Sudden Burst of Coalescence
Kim and Stephan (2002) use simulations to show that chance reductions in diversity are likely to span a small region of genome (Fig. 19.17).
Hey (1997) provides evidence that human mtDNA may have experienced recent selection.
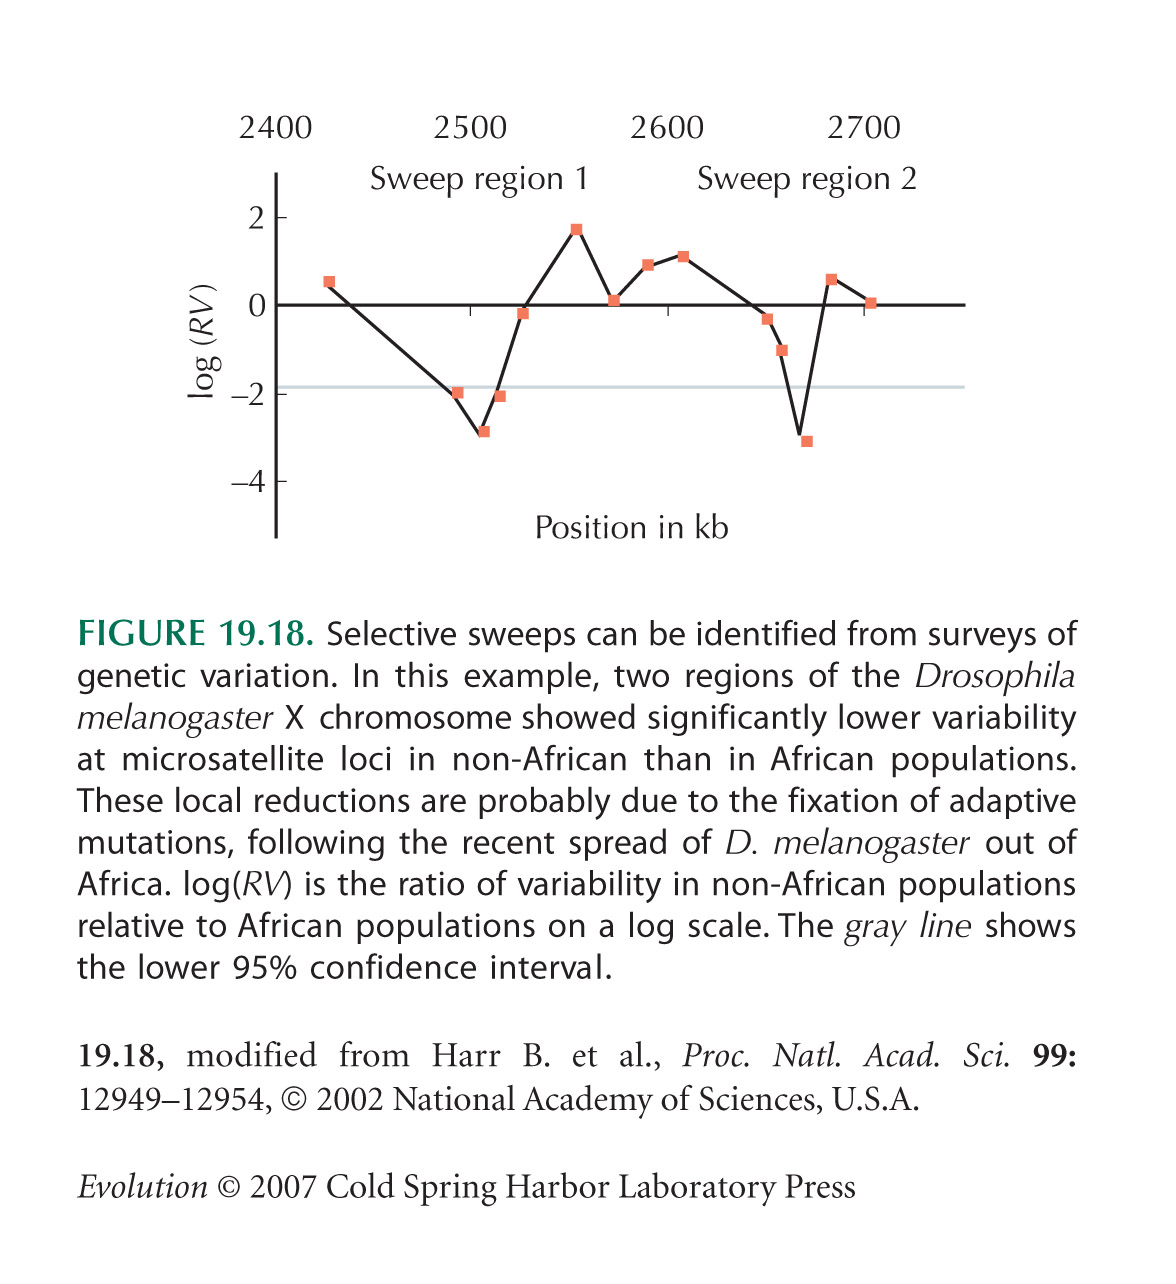
The example of a local reduction in diversity in European D. melanogaster (Fig. 19.18) is from Harr et al. (2002). This method identifies regions of exceptionally low diversity; it is not at all straightforward to show that these extremes are more extreme than would be expected by chance. Even if there were no selection, some regions of genome would have exceptionally low diversity. Further evidence is needed to determine whether these really have experienced selective sweeps.
Storz et al. (2004) make a genome-wide scan of variability in human populations, which identifies candidates for selective sweeps in non-African populations, an example similar to that in Figure 19.18.
In bacterial populations, which reproduce asexually, the phenomenon of hitchhiking causes a phenomenon known as periodic selection, which in principle allows advantageous substitutions to be detected. An initially homogeneous population will accumulate variation by mutation. However, when a favorable mutation sweeps through the population, this variation is eliminated. For further discussion, see Dykhuizen (1990) and Notley-McRobb and Ferenci (2000).
Variation around the tb1 locus suggest that it was selected during the domestication of maize (p. 317). Sequencing the tb1 gene from many populations of maize and teosinte revealed equivalent levels of variations within the coding region for both maize and teosinte alleles. In contrast, sequencing the DNA immediately 5′ of the start site for tb1 transcription indicated that the maize DNA exhibits very low levels of nucleotide variation, whereas the teosinte DNA 5′ to the transcription start site of tb1 had greater amounts of variation. The DNA immediately 5′ of the tb1 transcription start site is a likely location for regulatory domains controlling the transcription of tb1. These results can be interpreted as a molecular signature of selection for regulatory changes in tb1 during the domestication of this plant (Wang et al. 1999).
Williamson et al. (2007) identify 101 regions of the human genome that have patterns of variation that suggest a recent selective sweep. Teshima et al. (2006) show that these kinds of scans will often miss selective sweeps. Thus, it is hard to get a reliable estimate of the rate of sweeps.
Several statistics have been proposed that test distributions of allele frequencies for deviations from neutrality. We explain these .
Shapiro et al. (2007) use data from multiple Drosophila genome sequences to estimate the rate of selective sweeps; they argue that nearly one-third of the amino acid substitutions between D. melanogaster and its close relatives were fixed by positive selection. Hahn (2008) gives a wide-ranging commentary on this work, arguing that the neutral theory should no longer be taken as our null model.
Deleterious Mutations Reduce Variation at Linked Sites: Background Selection
The concept of background selection was introduced by Charlesworth et al. (1993).
Under the simplest model, where each mutation reduces fitness by a factor (1 – s), the distribution of numbers of mutations is Poisson (Chapter 28) with mean U/s. Therefore, the fraction of the population with no deleterious mutations is e–U/s. This can be small if the average number of mutations per chromosome, U/s, is large. (For example, if U/s = 20, this fraction is e–20 ~ 2 × 10⁻⁹.)
Hudson and Kaplan (1995b) derive the elegant result for the strength of background selection with recombination, e–U/R.
Figure 19.20 is from Baudry et al. (2001). The two genes on the right are in regions with high recombination compared with the three genes on the left, but this has no significant effect on diversity. (See Chapter 23 Web Notes.)
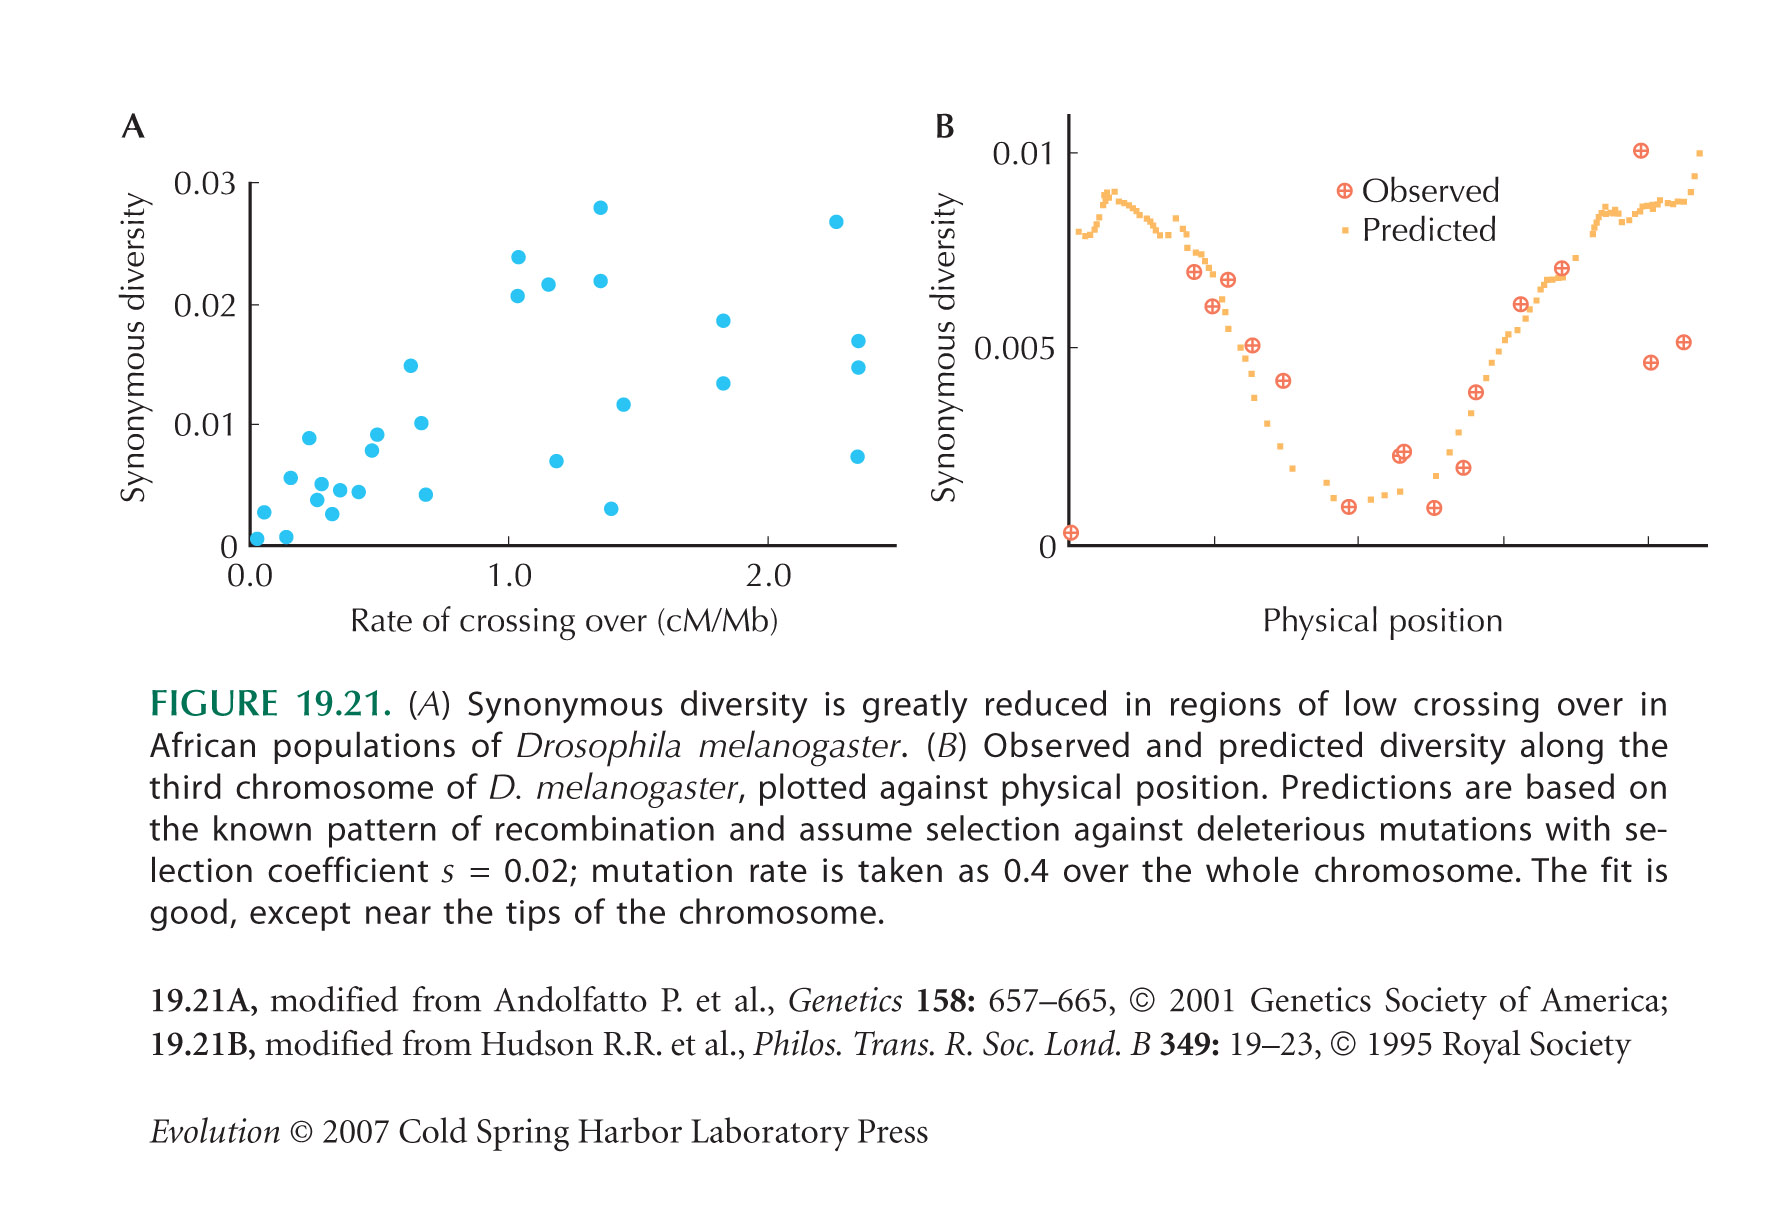
Figure 19.21A is from Andolfatto and Przeworski (2001). The comparison between observed and predicted diversity along the third chromosome of D. melanogaster (Fig. 19.21B) is from Hudson and Kaplan (1995a).
Balancing Selection Can Increase Neutral Variation
The example of polymorphism shared between species (Fig. 19.22) is from Richman (2000).
The Brassica sequence comparisons in Figure 19.23 are from Charlesworth (2002). One of the pairs of alleles that are found across different species has been shown to have retained the same incompatibility pattern, which requires that a particular combination of SP11 and SRK alleles has stayed together throughout the divergence of the species.
Hughes (1999) reviews MHC polymorphism.
The first attempt to detect balancing selection through its effect on neutral differences was the observation by Kreitman (1983) that variation is increased around the F/S gene of D. melanogaster. This study was highly influential, because it was among the first to demonstrate the possibility of detecting selection using sequence variation. However, the example has turned out to be not quite so straightforward. The F allele is relatively recent and has not in fact had time to accumulate many differences from the older S allele. The increase in diversity is instead found within the S allele of Adh and is also seen in an African sample, which did not contain the F allele (Begun et al. 1999). At present, the cause of this peak of increased variability is unknown.
The effects of inversions on sequence diversity in Drosophila are reviewed by Andolfatto et al. (2001).
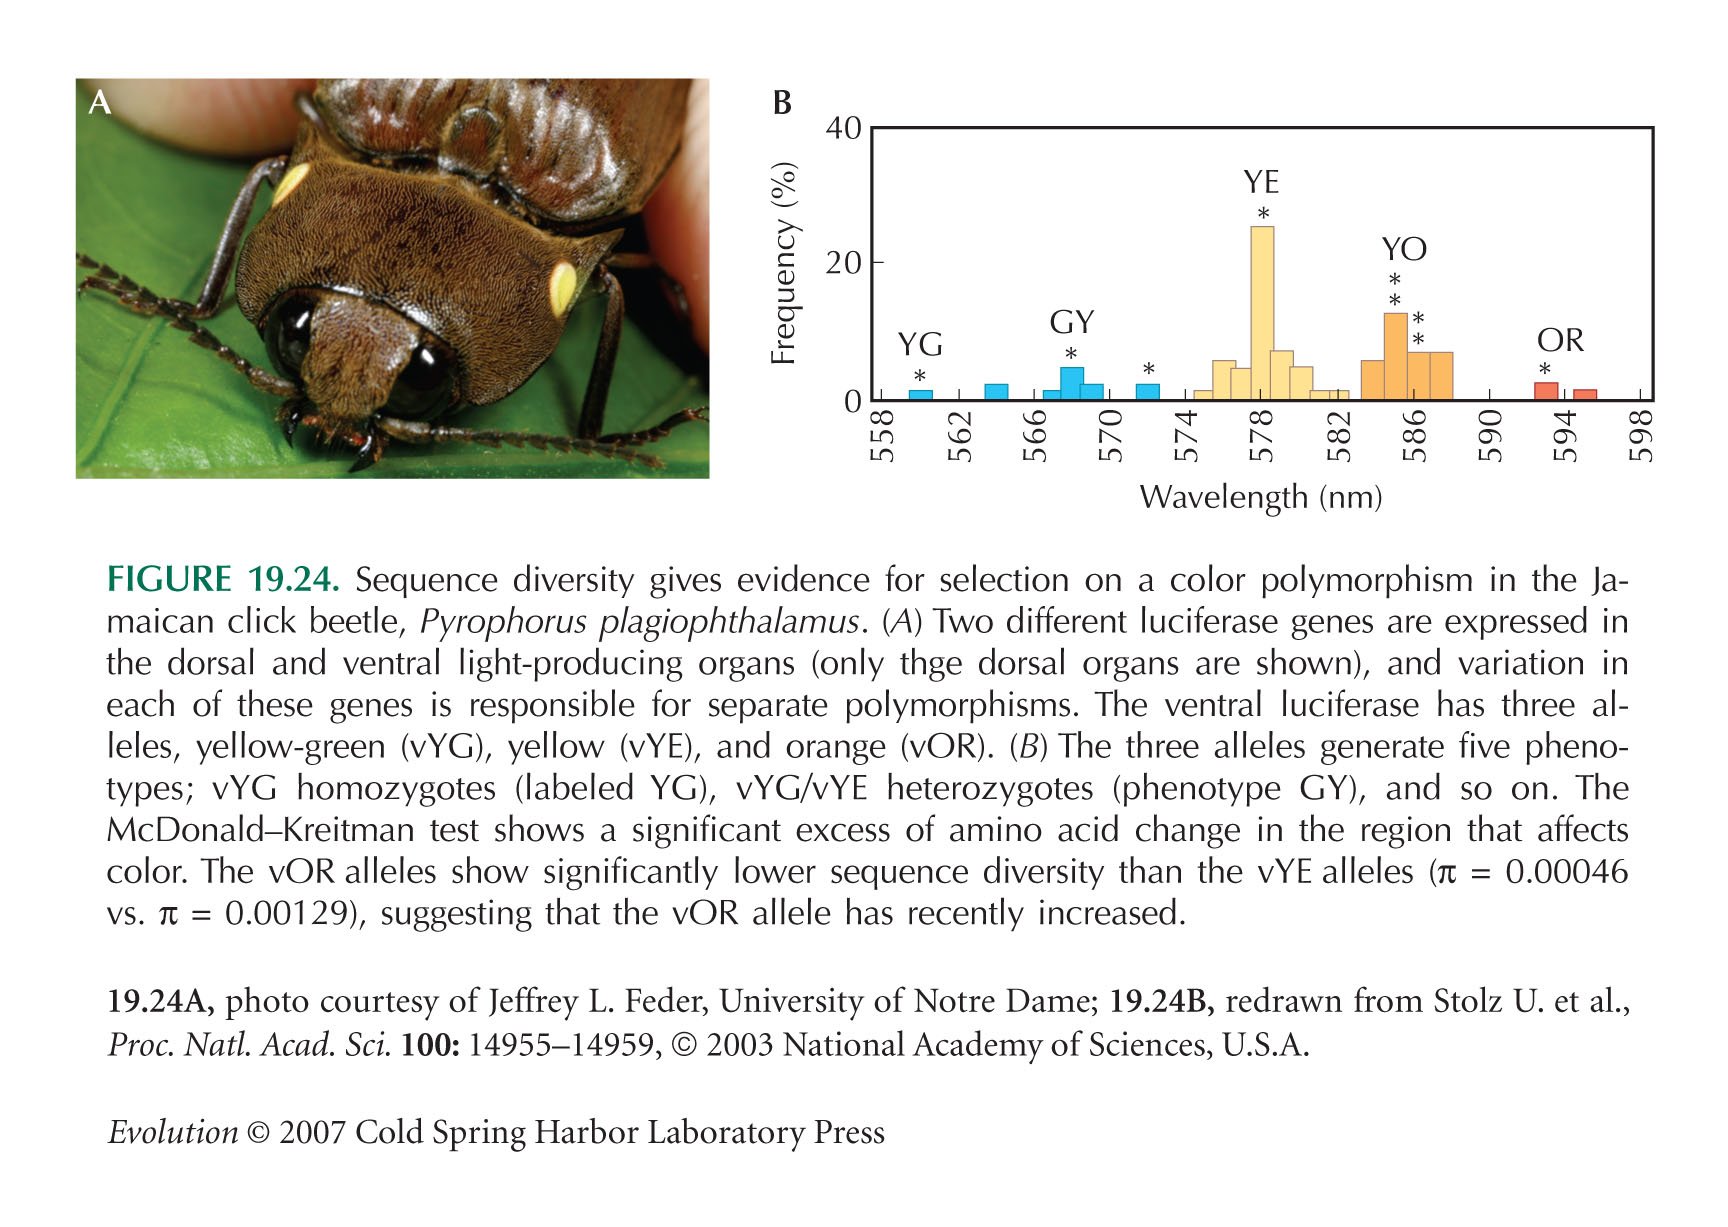
Figure 19.24B is from Stolz et al. (2003). For further evidence on the origins of the color alleles, see Velez and Feder (2006).
The HLA region of the human genome shows exceptionally high diversity, and indeed, the depth of this genealogy traces back to before the human–chimpanzee divergence. This reflects long-term balancing selection at this locus. However, there are few such regions in the human genome, and so long-term balancing selection is exceptional (Bubb et al. 2006). Nevertheless, balancing selection could still maintain substantial variation, because it would not increase neutral variation substantially even if it kept the selected alleles in a stable polymorphism for up to about Ne generations. Indeed, transient balancing selection may be associated with reduced variation t-linked neutral loci, as with Drosophila chromosome inversions, or human malaria-resistance polymorphisms (p. 542).
Selection on Noncoding DNA
Codon Usage Bias is Caused by Weak Selection for Translational Efficiency and Accuracy
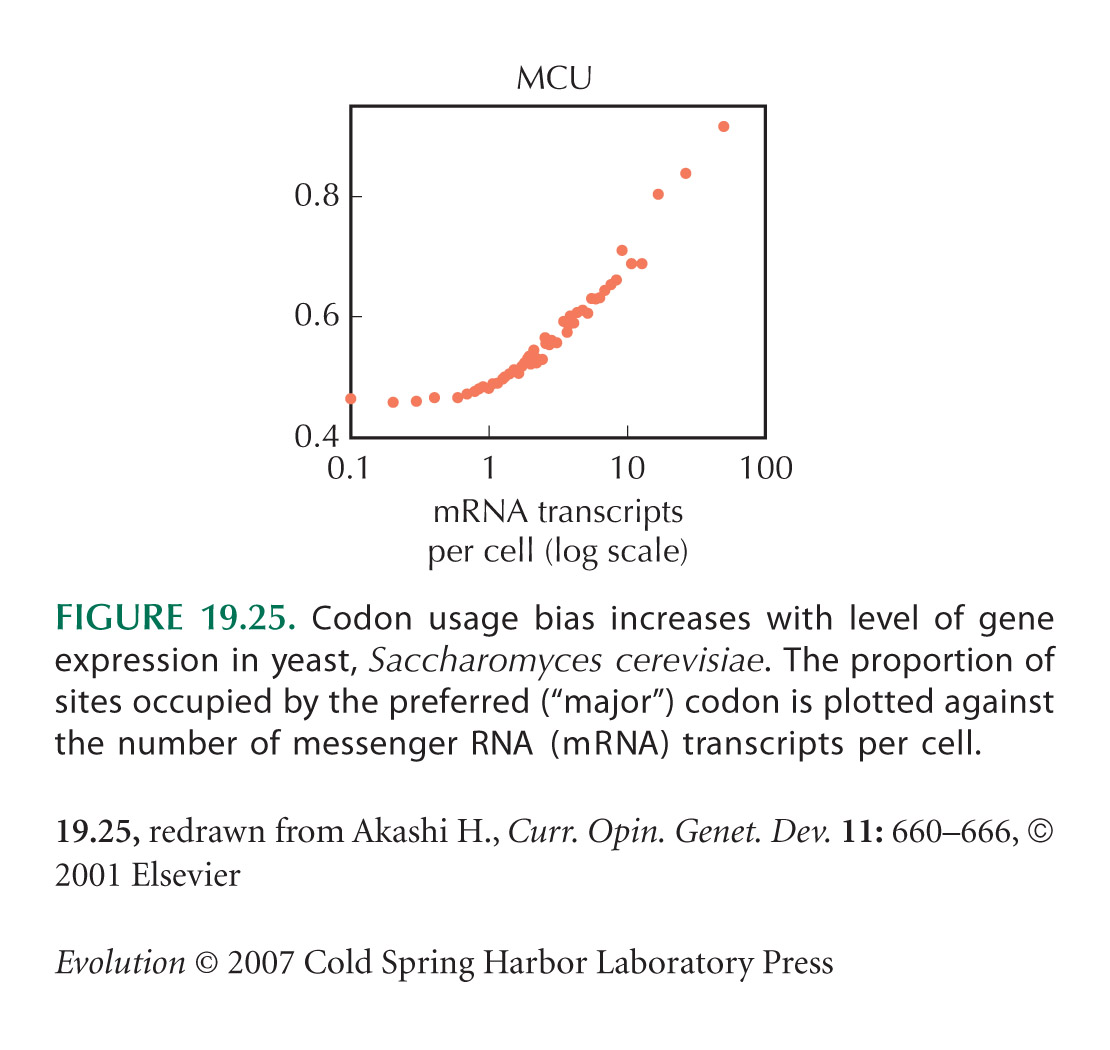
Figure 19.25 is from Akashi (2001). For a general review of codon usage bias, see Duret (2002).
One possible complication is that transcription of genes may alter the pattern of mutation. In principle, such mutational biases could explain correlations between codon usage and gene expression. However, in D. melanogaster and Caenorhabditis elegans, codon bias tends to increase GC content at the third position; yet, no such increase is seen in introns. This contrast between introns and third positions argues against mutation bias.
The example involving alternative splicing (p. 543) is from Iida and Akashi (2000).
Evidence for selection on translational accuracy, rather than rate, comes from Akashi (1994).
Figure 19.26 is from Smith and Eyre-Walker (2001), who discuss why suboptimal codons are used in E. coli.
Evidence that, in Drosophila, codon bias is weaker in regions of low recombination was given by Kliman and Hey (1994). Marais et al. (2001) find no such relationship in nematodes and argue that the Drosophila pattern is due to a mutational bias toward GC in regions of high recombination. Hey and Kliman (2002) give a convincing reply (see note 2 above).
Gillespie (2000, 2001) makes the argument that most random drift is due to selective sweeps, thus explaining why codon bias is not absolute even in very abundant species such as E. coli (Fig. 19.26).
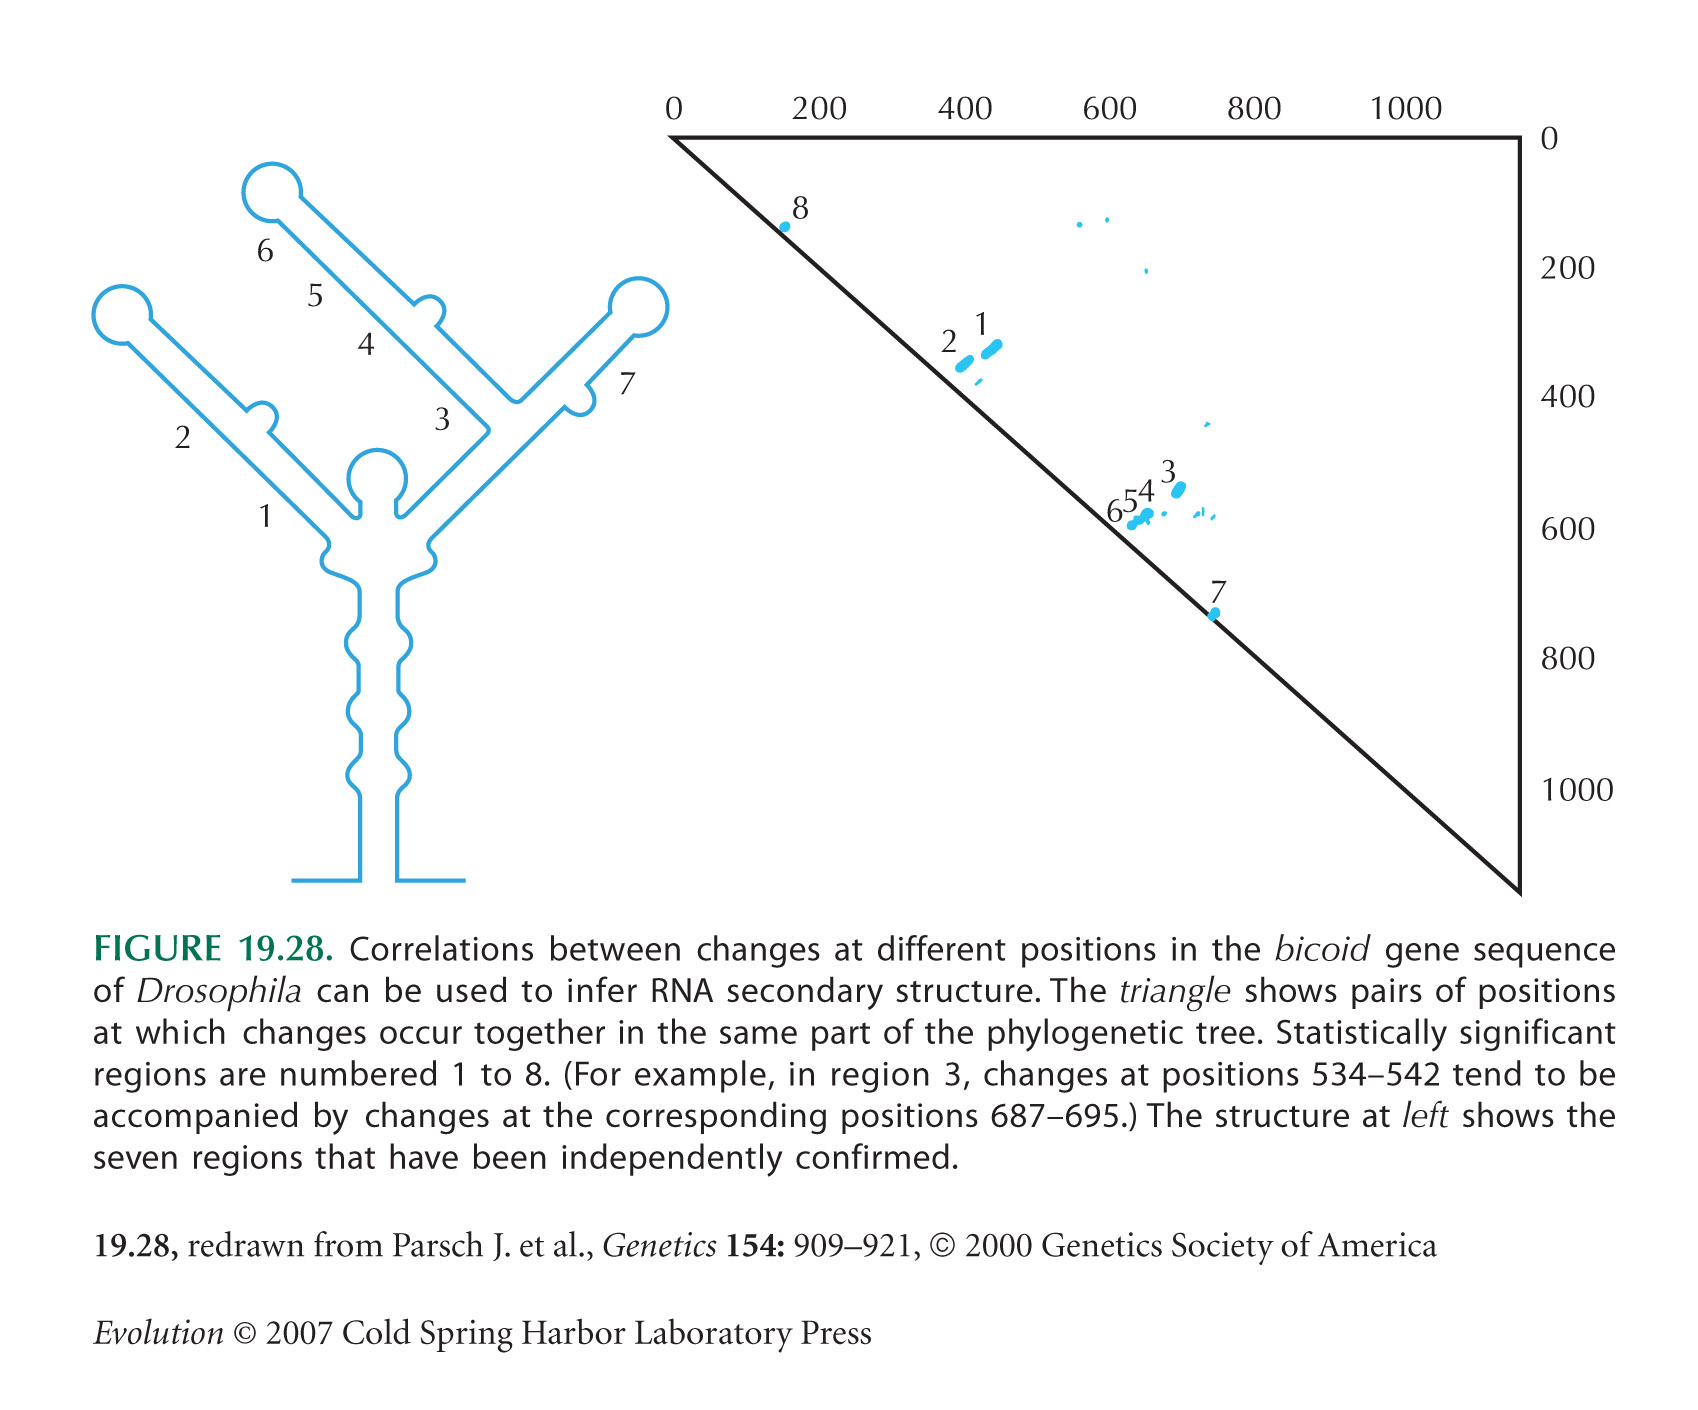
Selection for Pairing in RNA Molecules Can Be Detected
The bicoid example in Figure 19.28 is from Parsch et al. (2000).
If selection were strong relative to drift (i.e., Nes large), then changes from one complementary pair to another could occur only if both occurred in the same sequence and increased without being broken up by recombination. This would give a rate of substitution proportional to the square of the mutation rate (~µ2) compared with a rate equal to the mutation rate (~µ) for neutral sites, which is an extremely slow rate. Further evidence that change is by random drift, in opposition to selection, is that long stems evolve faster than short stems. This is presumably because a single change in a long paired region is less disruptive and so is opposed by weaker selection.
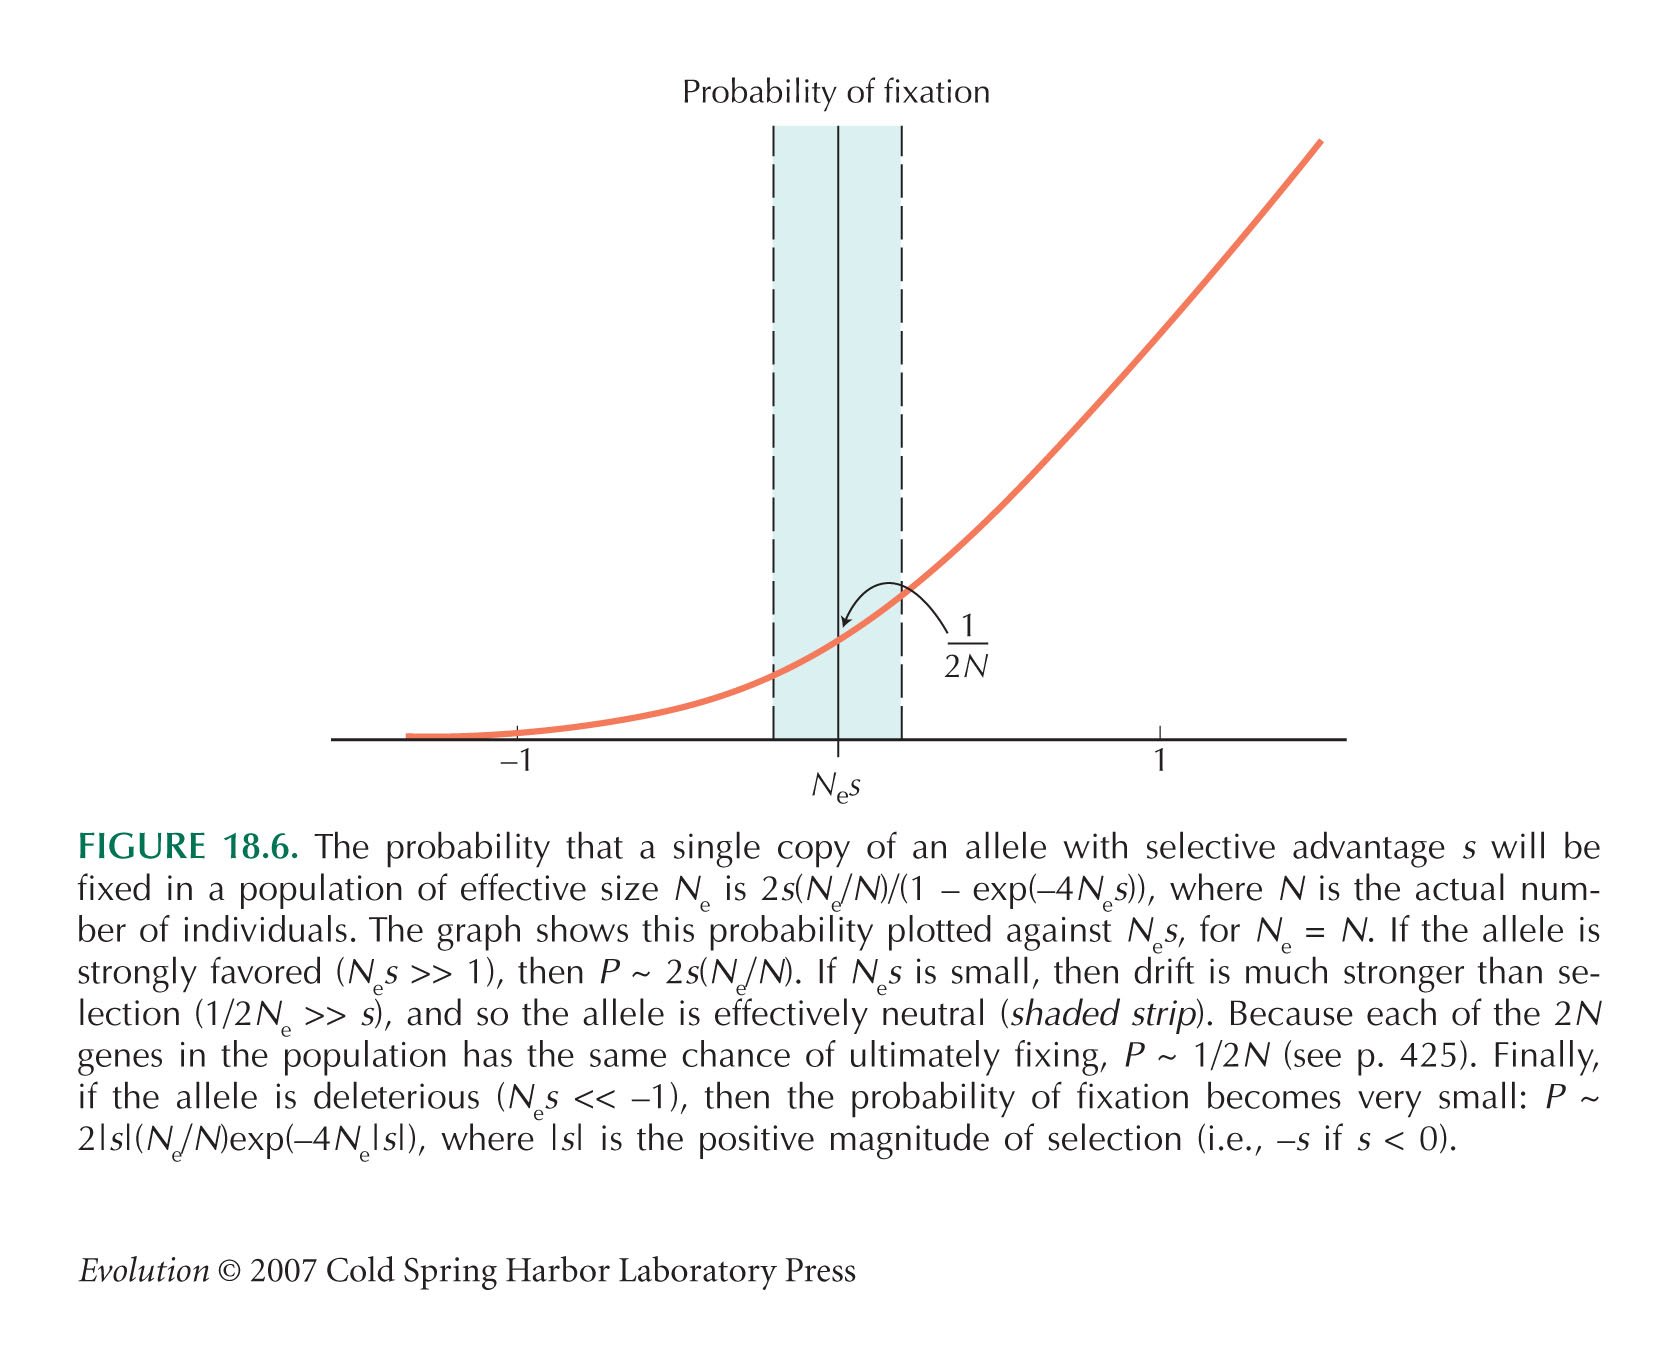
Just as with codon bias, the complementary pairing is not perfect: In some positions and in some species, the bases do not complement. This suggests that selection may not be strong enough to maintain the optimal sequence in the face of mutation and random drift. The strength of selection can be estimated from the rate at which complementary pairs evolve relative to the changes in other regions not involved in pairing. If selection is weak relative to drift (Nes ~ 1), a single mutation can get fixed by chance, despite slightly reducing the fidelity of pairing. The rate of such random fixations is ~µ e–Nes (Fig. 18.6). Once such a slightly deleterious mutation is fixed, changes that restore pairing will quickly be established, and so the site may shift to a new pair. The regions of bicoid involved in base pairing diverge between Drosophila species about half as fast as nonpairing regions, which implies that e– Nes ~ 1/2, and Nes ~ 0.7 (Parsch et al. 2000).
The example of segregating haplotypes in Drosophila Adh (Fig. 19.29) is from Kirby et al. (1995).
Functional Sequences Can Be Detected by Looking for Conserved Sequences
The mouse–human example of Figure 19.30 is from Shabalina et al. (2001).
Keightley and Gaffney (2003) use the mouse–rat comparison to estimate that the amount of functional noncoding sequence is similar to that of coding sequence; both contribute a mutational load of 0.22 per diploid per generation.
Waterston et al. (2002) (cited by Bentley 2003) estimate from comparison between mouse and human genomes that 5% of the human genome is conserved, 1.3% of that is coding sequence and the rest is noncoding.
Figure 19.31 is from Ludwig et al. (1998).
Several recent studies have identified short sequences that are absolutely conserved across a wide taxonomic range and that are presumably functional (e.g., Bejerano et al. 2004). However, a direct test of this hypothesis gave surprising results: Mice lacking sequences that were absolutely conserved between mouse and rat were apparently normal (Gross 2007; Ahituv et al. 2007).
A class of conserved “microRNA” molecules has recently been found to be involved in gene regulation. See Chen and Rajewsky (2006) and Michalak (2006).
See Chapter 26 Web Notes for evidence that noncoding regions in hominids are less constrained than those in rodents, possibly because the latter have larger effective population size.
Asthana et al. (2007) compare human, chimpanzee, mouse, dog, and rat genomes to show that there are widespread constraints on noncoding sequence.
The Extent of Selection
It Is Difficult to Measure the Extent to Which Fitness Itself Is Inherited
Burt (1995) reviews evidence on the genetic variance in fitness.
The study of Australian twins is from Kirk et al. (2001).
The study of heritability of fitness in red deer is from Kruuk et al. (2000). Kruuk (2004) gives a more recent review of this approach.
A special issue of the Proceedings of the Royal Society B (vol. 275, no. 1635) is devoted to studies of selection in natural populations of animals.
Evidence for the general importance of frequency-dependent selection comes from the observation that mixtures of varieties of crops yield more than homogeneous stands (see Bell 1997). This is partly due to better exploitation of diverse soil resources by diverse genotypes but may also be due to the slower spread of disease when the population contains a mixture of resistant and sensitive individuals. However, we do not know how many polymorphisms might be maintained by this general advantage to diversity. This kind of selection can give an advantage to sex and recombination (pp. 670–672).
Shabalina et al. (1997) measured the rate of fitness degradation in D. melanogaster. Rates of fitness decline in the absence of selection are reviewed by Burt (1995) and by Lynch et al. (1999). Burt (1995) explores the argument that the additive variance in fitness must equal the rate of fitness decline when selection is removed. Burt (1995) also discusses the fitness decline due to migration and estimates that gene flow between natural populations of plants reduces fitness by approximately 0.1–0.7% per generation.
The Overall Extent of Selection Is Limited by Genetic Load
Crow (1993) and Barton and Partridge (2000) give general reviews of genetic load.
There Are Several Kinds of Load, Corresponding to Different Kinds of Selection
Haldane (1957) introduced the idea of a “cost of natural selection.” Maynard Smith (1968, 1976) argued that it is better termed a “lag load” (i.e., the loss of mean fitness arising because the population lags behind the current environment). Kimura (1961) uses an intriguing argument to relate the load to the increase in information introduced by natural selection; see also Kimura (1995). That argument was developed independently by Worden (1995).
For further details on Biston, see the Majerus (1998, 2005).
The exact formula for the substitution load depends on the degree of dominance. As we saw in Box 17.2 (p. 476), a completely dominant allele increases faster at first, and therefore leads to a smaller net load of loge(1/p). This is half as great as with additive action.
Deleterious Mutations and Balancing Selection Also Cause a Genetic Load
Haldane (1937) first showed that the loss of fitness due to mutation is independent of selection coefficient. Muller (1950) coined the term mutation load; he had shown that radiation generates mutations, and he emphasized the damaging consequences of atomic weapons tests. See Crow (1993, 1997, 2000) and Crow and Abrahamson (1997).
Keightley and Eyre-Walker (2000) review estimates of genomic mutation rate, U, and conclude that U is likely to be much less than 1 in organisms with a short generation time (but see the reply by Kondrashov 2000). However, U may be substantial in longer-lived organisms such as humans; a recent direct measurement of mutation rate suggests that U ~ 1.2 for Drosophila (Haag-Liautard et al. 2007).
Balancing selection entails a segregation load. If heterozygotes are fitter than either homozygote, then a polymorphism will be maintained (Box 17.1). However, homozygotes will continually be generated, and so the population cannot contain more than 50% of the fittest genotype, the heterozygote. For example, imagine that heterozygotes are s = 1% fitter than homozygotes at each of 3000 genes. (This is approximately comparable with the level of amino acid polymorphism in Drosophila, although for simplicity, we have assumed that there are two alleles at equal frequency.) An average individual would be homozygous at 1500 of these genes and so would have its fitness reduced by a factor ~(1 – s)1500 ~ e–15 ~ 1/3,300,000, relative to the optimal genotype, which is heterozygous at all 3000 polymorphic loci. It is absurd to suppose that the ideal individual could produce three million times as many offspring as the average. This argument suggests that if heterozygote advantage is responsible for widespread polymorphism, and if the effects of different genes multiply together, as we have assumed, then selection must be quite weak (s < 0.1%, say).
Interactions between Genes Can Greatly Alleviate the Load
Papers that discuss the difficulties in using load arguments to set limits on the power of selection include Maynard Smith (1968), Sved et al. (1967), Sved (1968), Turner and Williamson (1968), and Wills (1978). Kimura (1983, Chapter 6.5) gives a review that is more sympathetic to load arguments.
Weatherall (1991, Chapter 2) discussed the incidence of inherited disease in human populations. See also Vogel and Motulsky (1997, Chapter 4.1.8).
Kimura and Maruyama (1966) show that the mutation load can be reduced by epistasis in a sexually reproducing population but not with asexual reproduction. Kondrashov (1988) takes this argument further to show that sexual reproduction can be selected because it reduces the mutation load (see p. 680).
Problem 23.10 shows how interactions between deleterious mutations can greatly reduce the genetic load when reproduction is sexual.
References
Adams M.D., Celniker S.E., Holt R.A., et al. 2000. The genome sequence of Drosophila melanogaster. Science 287: 2185–2195.
Ahituv N., Zhu Y., Visel A., Holt A., Afzal V., et al. 2007. Deletion of ultraconserved elements yields viable mice. PLoS Biol. 5: e234. doi:10.1371/journal.pbio.0050234.
Akashi H. 1994. Synonymous codon usage in Drosophila melanogaster: Natural selection and translational accuracy. Genetics 136: 927–935.
Akashi H. 2001. Gene expression and molecular evolution. Curr. Opin. Genet. Dev. 11: 660–666.
Andolfatto P. and Przeworski M. 2001. Regions of lower crossing over harbor more rare variants in African populations of Drosophila melanogaster. Genetics 158: 657–665.
Andolfatto P., Depaulis F., and Navarro A. 2001. Inversion polymorphisms and nucleotide polymorphism: Lessons from Drosophila. Genet. Res. 77: 1–8.
Asthana S., Noble W.S., Kryukov G., Grantt C.E., Sunyaev S., and Stamatoyannopoulos J.A. 2007. Widely distributed noncoding purifying selection in the human genome. Proc. Natl. Acad. Sci. 104: 12410–12415.
Barnes B.W. and Kearsey M.J. 1970. Variation for metrical characters in Drosophila populations. I. Genetic analysis. Heredity 25: 1–10.
Barton N. and Partridge L. 2000. Limits to natural selection. Bioessays 22: 1075–1084.
Barton N.H. 1990. Pleiotropic models of quantitative variation. Genetics 124: 773–782.
Barton N.H. and Gale K.S. 1993. Genetic analysis of hybrid zones. In Hybrid zones and the evolutionary process (ed. R. G. Harrison), pp. 13–45. Oxford University Press, Oxford.
Barton N.H. and Hewitt G.M. 1985. Analysis of hybrid zones. Annu. Rev. Ecol. Syst. 16: 113–148.
Baudry E., Kerdelhue C., Innan H., and Stephan W. 2001. Species and recombination effects on DNA variability in the tomato genus. Genetics 158: 1725–1735.
Begun D.J., Betancourt A.J., Langley C.H., and Stephan W. 1999. Is the fast/slow allozyme variation at the Adh locus of Drosophila melanogaster an ancient balanced polymorphism? Mol. Biol. Evol. 16: 1816–1819.
Bejerano G., Pheasant M., Makunin I., Stephen S., Kent W.J., Mattick J.S., and Haussler D. 2004. Ultraconserved elements in the human genome. Science 304: 1321–1325.
Bell G. 1985. On the function of flowers. Proc. R Soc. Lond. B 224: 223–265.
Bell G. 1997. Selection: The mechanism of evolution. Chapman and Hall, New York.
Bell M.A., Travis M.P., and Blouw D.M. 2006. Inferring natural selection in a fossil threespine stickleback. Paleobiology 32: 562–577.
Bentley D.R. 2003. DNA sequence variation of Homo sapiens. Cold Spring Harbor Symp. Quant. Biol. 68: 55–63.
Berry A. and Kreitman M. 1993. Molecular analysis of an allozyme cline: Alcohol dehydrogenase in Drosophila melanogaster on the east coast of N. America. Genetics 134: 869–893.
Bubb K.L., Bovee D., Buckley D., Haugen E., Kibukawa M., et al. 2006. Scan of human genome reveals no new loci under ancient balancing selection. Genetics 173: 2165–2177.
Bumpus H.C. 1899. The elimination of the unfit as illustrated by the introduced sparrow, Passer domesticus. Biol. Lectures, Marine Biol. Lab, Woods Hole: 209–226.
Burt A. 1995. The evolution of fitness. Evolution 49: 1–8.
Butlin R.K., Ritchie M.G., and Hewitt G.M. 1991. Comparisons among morphological characters and between localities in the Chorthippus paralellus hybrid zone (Orthoptera: Acrididae). Philos. Trans. R Soc. Lond. B 334: 297–308.
Chambers G.K. 1988. The Drosophila alcohol dehydrogenase gene-enzyme system. Adv. Genet. 25: 39–107.
Charlesworth B., Morgan M.T., and Charlesworth D. 1993. The effect of deleterious mutations on neutral molecular variation. Genetics 134: 1289–1303.
Charlesworth D. 2002. Self-incompatibility: How to stay incompatible. Curr. Biol. 12: R424–R426.
Charlesworth J. and Eyre Walker A. 2007. The other side of the nearly neutral theory, evidence of slightly advantageous back-mutations. Proc. Natl. Acad. Sci. 104: 16992–16997.
Chen K. and Rajewsky N. 2006. Natural selection on human microRNA binding sites inferred from SNP data. Nat. Genet. 38: 1452–1458.
Coyne J. 1982. Gel electrophoresis and cryptic protein variation. Curr. Top. Biol. Med. Res. 6: 1–32.
Crow J.F. 1993. Mutation, mean fitness and genetic load. Oxf. Surv. Evol. Biol. 9: 3–42.
Crow J.F. 1997. The high spontaneous mutation rate: Is it a health risk? Proc. Natl. Acad. Sci. 94: 8380–8386.
Crow J.F. 2000. The origins, patterns and implications of human spontaneous mutation. Nat. Rev. Genet. 1: 40–47.
Crow J.F. and Abrahamson S. 1997. Seventy years ago: Mutation becomes experimental—H. J. Muller. Genetics 147: 1491–1496.
Dean A.M. 1989. Selection and neutrality in lactose operons of Escherichia coli. Genetics 123: 441–454.
Dean A.M. 1995. A molecular investigation of genotype by environment interaction. Genetics 139: 19–33.
Duret L. 2002. Evolution of synonymous codon usage in metazoans. Curr. Opin. Genet. Dev. 12: 640–649.
Dykhuizen D.E. 1990. Experimental studies of natural selection in bacteria. Annu. Rev. Ecol. Syst. 21: 373–398.
Endler J.A. 1986. Natural selection in the wild. Princeton University Press, Princeton, New Jersey.
Ewens W.J. 1972. The sampling theory of selectively neutral alleles. Theor. Popul. Biol. 3: 87–112.
Fay J.C. and Wu C.I. 2000. Hitchhiking under positive Darwinian selection. Genetics 155: 1405–1413.
Fay J., Wycoff G.J., and Wu C.I. 2001. Positive and negative selection on the human genome. Genetics 158: 1227–1234.
Fowler K., Semple C., Barton N.H., and Partridge L. 1997. Genetic variation for total fitness in Drosophila melanogaster. Proc. R. Soc. Lond. B 264: 191–199.
Giaever G., Chu A.M., Ni L., Connelly C., Riles L., et al. 2002. Functional profiling of the Saccharomyces cerevisiae genome. Nature 418: 387–391.
Gillespie J.H. 1991. The causes of molecular evolution. Oxford University Press, Oxford.
Gillespie J.H. 2000. Genetic drift in an infinite population: The pseudohitchhiking model. Genetics 155: 909–919.
Gillespie J.H. 2001. Is the population size of a species relevant to its evolution? Evolution 55: 2161–2169.
Grant P.R. 1986. The evolution and ecology of Darwin’s finches. Princeton University Press, Princeton, New Jersey.
Gross L. 2007. Are “ultraconserved” genetic elements really indispensable? PLoS Biol. 5: e253.
Haag-Liautard C., Dorris M., Maside X., Macaskill S., Halligan D.L., Charlesworth B., and Keightley P.D. 2007. Direct estimation of per nucleotide and genomic deleterious mutation rates in Drosophila. Nature 445: 82–85.
Hahn M.W. 2008. Towards a selection theory of molecular evolution. Evolution 62: 255–265.
Haldane J.B.S. 1937. The effect of variation on fitness. Am. Nat. 71: 337–349.
Haldane J.B.S. 1957. The cost of natural selection. J. Genet. 55: 511–524.
Hamblin M.T. and Di Rienzo A. 2000. Detection of the signature of natural selection in humans: Evidence from the Duffy blood group locus. Am. J. Hum. Genet. 66: 1669–1679.
Hamblin M.T., Thompson E.E., and Di Rienzo A. 2002. Complex signatures of natural selection at the Duffy blood group locus. Am. J. Hum. Genet. 70: 369–383.
Harr B., Kauer M., and Schlotterer C. 2002. Hitchhiking mapping: A population-based fine-mapping strategy for adaptive mutations in Drosophila melanogaster. Proc. Natl. Acad. Sci. 99: 12949–12954.
Hartl D.L. 1989. The physiology of weak selection. Genome 31: 183–189.
Hendry A.P. 2008. Darwin in the fossils. Nature 451: 779–780.
Hereford J., Hansen T.F., and Houle D. 2004. Comparing strengths of directional selection: How strong is strong? Evolution 58: 2133–2143.
Hey J. 1997. Mitochondrial and nuclear genes present conflicting portraits of human origins. Mol. Biol. Evol. 14: 166–172.
Hey J. and Kliman R.M. 2002. Interactions between natural selection, recombination and gene density in the genes of Drosophila. Genetics 160: 595–608.
Hild M., Beckmann B., Haas S.A., Koch B., Solovyev V., et al. 2003. An integrated gene annotation and transcriptional profiling approach towards the full gene content of the Drosophila genome. Genome Biol. 5: R3.
Hudson R.R. and Kaplan N.L. 1995a. The coalescent process with background selection. Philos. Trans. R. Soc. Lond. B 349: 19–23.
Hudson R.R. and Kaplan N.L. 1995b. Deleterious background selection with recombination. Genetics 141: 1605–1617.
Hughes A.L. 1999. Adaptive evolution of genes and genomes. Oxford University Press, Oxford.
Iida K. and Akashi H. 2000. A test of translational selection at “silent” sites in the human genome: Base composition comparisons in alternatively spliced genes. Gene 261: 93–105.
Johnston R.F., Niles D.M., and Rohwer S.A. 1972. Herman Bumpus and natural selection in the house sparrow Passer domesticus. Evolution 26: 20–31.
Kearsey M.J. and Barnes B.W. 1970. Variation for metrical characters in Drosophila populations. II. Natural selection. Heredity 25: 11–21.
Keightley P.D. and Eyre-Walker A. 2000. Deleterious mutations and the evolution of sex. Science 290: 331–333.
Keightley P.D. and Gaffney D.J. 2003. Functional constraints and frequency of deleterious mutations in noncoding DNA of rodents. Proc. Natl. Acad. Sci. 100: 13402–13406.
Kim Y. and Stephan W. 2002. Detecting a local signature of genetic hitchhiking along a recombining chromosome. Genetics 160: 765–777.
Kimura M. 1961. Natural selection as the process of accumulating genetic information in adaptive evolution. Genet. Res. 2: 127–140.
Kimura M. 1983. The neutral theory of molecular evolution. Cambridge University Press, Cambridge.
Kimura M. 1995. Limitations of Darwinian selection in a finite population. Proc. Natl. Acad. Sci. 92: 2343–2344.
Kimura M. and Maruyama T. 1966. Mutational load with epistatic gene interactions in fitness. Genetics 54: 1337–1351.
Kingsolver J.G., Hoekstra H.E., Hoekstra J.M., Berrigan D., Vignieri S.N., et al. 2001. The strength of phenotypic selection in natural populations. Am. Nat. 157: 245–261.
Kirby D.A., Muse S.V., and Stephan W. 1995. Maintenance of pre-mRNA secondary structure by epistatic selection. Proc. Natl. Acad. Sci. 92: 9047–9051.
Kirk K.M., Blomberg S.P., Duffy D.L., Heath A.C., Owens I.P.F., et al. 2001. Natural selection and quantitative genetics of life-history traits in western women: A twin study. Evolution 55: 423–435.
Kliman R.M. and Hey J. 1994. The effects of mutation and natural selection on codon bias in the genes of Drosophila. Genetics 137: 1049–1056.
Kondrashov A.S. 1988. Deleterious mutations and the evolution of sexual reproduction. Nature 336: 435–441.
Kondrashov A.S. 2000. Sex and U. Trends Genet. 17: 75–77.
Kondrashov A.S. and Turelli M. 1992. Deleterious mutations, apparent stabilising selection and the maintenance of quantitative variation. Genetics 132: 603–618.
Kreitman M. 1983. Nucleotide polymorphisms at the alcohol dehydrogenase locus of Drosophila melanogaster. Nature 304: 412–417.
Kreitman M. and Hudson R.R. 1991. Inferring the evolutionary histories of the Adh and Adh-dup loci in D. melanogaster from patterns of polymorphism and divergence. Genetics 127: 565–582.
Kruuk L.E.B. 2004. Estimating genetic parameters in natural populations using the “animal model.” Philos. Trans. R. Soc. Lond. B 359: 873–890.
Kruuk L.E.B., Clutton Brock T.H., Slate J., Pemberton J., Brotherstone S., and Guiness F.E. 2000. Heritability of fitness in a wild mammal population. Proc. Natl. Acad. Sci. 97: 698–703.
Kruuk L.E.B., Slate J., Pemberton J.M., Brotherstone S., Guiness F.E., et al. 2002. Antler size in red deer: Heritability and selection but no evolution. Evolution 56: 1683–1695.
Lande R. and Arnold S.J. 1983. The measurement of selection on correlated characters. Evolution 37: 1210–1226.
Langley C.H., Voelker R.A., Leigh-Brown A.J., Ohnishi S., Dickson B., et al. 1981. Null allele frequencies at allozyme loci in natural populations of Drosophila melanogaster. Genetics 99: 151–156.
Laurie-Ahlberg C.C. 1985. Genetic variation affecting the expression of enzyme-coding genes in Drosophila: An evolutionary perspective. Curr. Top. Biol. Med. Res. 12: 33–88.
Ludwig M.Z., Patel N.H., and Kreitman M. 1998. Functional analysis of eve stripe 2 enhancer evolution in Drosophila: Rules governing conservation and change. Development 125: 949–958.
Lynch M., Blanchard J., Houle D., Kibota T., Schultz S., Vassilieva L., and Willis J. 1999. Spontaneous deleterious mutation. Evolution 53: 645–663.
Majerus M.E.N. 1998. Melanism: Evolution in action. Oxford University Press, Oxford.
Majerus M.E.N. 2005. The peppered moth: Decline of a Darwinian disciple. In Insect evolutionary biology (ed. M.D.E. Fellowes et al.). CABI Publishing, Wallingford, United Kingdom.
Marais G., Mouchiroud D., and Duret L. 2001. Does recombination improve selection on codon usage? Lessons from nematode and fly complete genomes. Proc. Natl. Acad. Sci. 98: 5688–5692.
Maynard Smith J. 1968. “Haldane’s dilemma” and the rate of evolution. Nature 219: 1114–1116.
Maynard Smith J. 1976. What determines the rate of evolution? Am. Nat. 110: 331–338.
McDonald J.H. and Kreitman M. 1991. Adaptive protein evolution at the Adh locus in Drosophila. Nature 351: 652–654.
Merila J., Sheldon B.C., and Kruuk L.E.B. 2001. Explaining stasis: Microevolutionary studies in natural populations. Genetics 112–113: 199–222.
Michalak P. 2006. RNA world—The dark matter of evolutionary genomics. J. Evol. Biol. 19: 1768–1774.
Morjan C.L. and Rieseberg L.H. 2004. How species evolve collectively: Implications of gene flow and selection for the spread of advantageous alleles. Mol. Ecol. 13: 1341–1356.
Muller H.J. 1950. Our load of mutations. Am. J. Hum. Genet. 2: 111–176.
Notley-McRobb L. and Ferenci T. 2000. Experimental analysis of molecular events during mutational periodic selections in bacterial evolution. Genetics 156: 1493–1501.
O’Donald P. 1973. A further analysis of Bumpus’ data: The intensity of natural selection. Evolution 27: 398–404.
Ohta T. 1996. The current significance and standing of neutral and nearly neutral theories. BioEssays 18: 673–677.
Ohta T. 2002. Near-neutrality in evolution of genes and gene regulation. Proc. Natl. Acad. Sci. 99: 16134–16137.
Ohta T. and Gillespie J.H. 1996. Development of neutral and nearly-neutral theories. Theor. Popul. Biol. 49: 128–142.
Orr H.A. 1998. Testing natural selection vs. genetic drift in phenotypic evolution using quantitative trait locus data. Genetics 149: 2099–2104.
Parsch J., Braverman J.M., and Stephan W. 2000. Comparative sequence analysis and patterns of covariation in RNA secondary structures. Genetics 154: 909–921.
Pearson K. 1903. Mathematical contributions to the theory of evolution. XI. On the influence of natural selection on the variability and correlation of organs. Philos. Trans. R Soc. Lond. A 200: 1–66.
Powers D.A., Smith M., Gonzalez-Villasenor I., Dimichele L., Crawford D., et al. 1993. A multidisciplinary approach to the selectionist/neutralist controversy using the model teleost Fundulus heteroclitus. Oxf. Surv. Evol. Biol. 1993: 43–107.
Richman A. 2000. Evolution of balanced genetic polymorphism. Mol. Ecol. 9: 1953–1964.
Rieseberg L.H., Church S.A., and Morjan C.L. 2003. Integration of populations and differentiation of species. New Phytol. 161: 59–69.
Rosenzweig R.F., Sharp R.R., Treves D.S., and Adams J. 1994. Microbial evolution in a simple unstructured environment: Genetic differentiation in E. coli. Genetics 137: 903–917.
Rowe L.V., Evans M.R., and Buchanan K.L. 2001. The function and evolution of the tail streamer in hirundines. Behav. Ecol. 12: 157–163.
Rozen D.E., De Visser J.A.G.M., and Gerrish P.J. 2003. Fitness effects of fixed beneficial mutations in microbial populations. Curr. Biol. 12: 1040–1045.
Schluter D. 1988. Estimating the form of natural selection on a quantitative trait. Evolution 42: 849–861.
Shabalina S.A., Yampolsky L.Y., and Kondrashov A.S. 1997. Rapid decline of fitness in panmictic populations of Drosophila melanogaster maintained under relaxed natural selection. Proc. Natl. Acad. Sci. 94: 13034–13039.
Shabalina S.A., Ogurtsov A.Y., Kondrashov V.A., and Kondrashov A.S. 2001. Selective constraint in intergenic regions of human and mouse genomes. Trends Genet. 17: 373–376.
Shapiro J.A., Huang W., Zhang C.H., Hubisz M.J., Lu J., Turissini D.A., Fang S., Wang H.Y., Hudson R.R., Nielsen R., Chen Z., and Wu C.I. 2007. Adaptive genic evolution in the Drosophila genomes. Proc. Natl. Acad. Sci. 104: 2271–2276.
Skibinski D.O.F., Woodwark M., and Ward R.D. 1993. A quantitative test of the neutral theory using pooled allozyme data. Genetics 135: 233–248.
Smith N.G.C. and Eyre-Walker A. 2001. Why are translationally sub-optimal synonymous codons used in Escherichia coli? J. Mol. Evol. 53: 225–236.
Smith N.G.C. and Eyre-Walker A. 2002. Adaptive protein evolution in Drosophila. Nature 415: 1022–1024.
Smith N.G.C. and Eyre-Walker A. 2003. Partitioning the variation in mammalian substitution rates. Mol. Biol. Evol. 20: 10–17.
Stolz U., Velez S., Wood K.V., Wood M., and Feder J.L. 2003. Darwinian natural selection for orange bioluminescent color in a Jamaican click beetle. Proc. Natl. Acad. Sci. 100: 14955–14959.
Storz J.F., Payseur B.A., and Nachman M.W. 2004. Non-African origin of a local beneficial mutation in D. melanogaster. Mol. Biol. Evol. 21: 1800–1811.
Sved J.A. 1968. Possible rates of gene substitution in evolution. Am. Nat. 102: 283–293.
Sved J.A., Reed T.E., and Bodmer W.F. 1967. The number of balanced polymorphisms that can be maintained by natural selection. Genetics 55: 469–481.
Swanson W.J. 2003. Adaptive evolution of genes and gene families. Curr. Opin. Genet. Dev. 13: 617–622.
Tajima F. 1989. Statistical method for testing the neutral mutation hypothesis by DNA polymorphism. Genetics 123: 585–595.
Teshima K.M., Coop G., and Przeworski M. 2006. How reliable are empirical genomic scans for selective sweeps? Genome Res. 16: 702–712.
Thatcher J.W., Shaw J.M., and Dickinson W.J. 1998. Marginal fitness contributions of nonessential genes in yeast. Proc. Natl. Acad. Sci. 95: 253–257.
Turner J.R.G. and Williamson M. 1968. Population size, natural selection, and genetic load. Nature 218: 700–700.
Van Delden W. 1982. The alcohol dehydrogenase polymorphism in Drosophila melanogaster: Selection at an enzyme locus. Evol. Biol. 15: 187–222.
Van Delden W., Boerema A.C., and Kamping A. 1978. The alcohol dehydrogenase polymorphism in populations of Drosophila melanogaster. I. Selection in different environments. Genetics 90: 161–191.
Velez S. and Feder J.L. 2006. Integrating biogeographic and genetic approaches to investigate the history of bioluminescent colour alleles in the Jamaican click beetle Pyrophorus plagiophthalamus. Mol. Ecol. 15: 1393–1404.
Vogel F. and Motulsky A.G. 1997. Human genetics: Problems and approaches. Springer-Verlag, Berlin.
Wang R.L., Stec A., Hey J., Ukens L., and Doebley J. 1999. The limits of selection during maize domestication. Nature 398: 236–239. (See correction, Nature 410: 718).
Ward R. and Beardmore J.A. 1977. Protein variation in the plaice, Pleuronectes platessa, L. Genet. Res. 30: 45–62.
Waterston R.H., Lindblad-Toh K., Birney E., et al. (Mouse Genome Sequencing Consortium). 2002. Initial sequencing and comparative analysis of the mouse genome. Nature 420: 520–562.
Watt W.B. and Dean A.M. 2000. Molecular-functional studies of adaptive genetic variation in prokaryotes and eukaryotes. Annu. Rev. Genet. 34: 593–622.
Watterson G.A. 1978. The homozygosity test of neutrality. Genetics 88: 405–417.
Weatherall D.J. 1991. The new genetics and clinical practice, 3rd ed. Oxford University Press, Oxford.
Williamson S.H., Hubisz M.T., Clark A.G., Payseur B.A., Bustamante C.D., and Nielsen R. 2007. Localizing recent adaptive evolution in the human genome. PLoS Genet. 3: 10.1371/journal.pgen.0030090.
Wills C.J. 1978. Rank-order selection is capable of maintaining all genetic polymorphisms. Genetics 89: 403–417.
Worden R.P. 1995. A speed limit for evolution. J. Theor. Biol. 176: 137–152.
Yandell M., Bailey A.M., Misra S., Shu S.Q., Wiel C., et al. 2005. A computational and experimental approach to validating annotations and gene predictions in the Drosophila melanogaster genome. Proc. Natl. Acad. Sci. 102: 1566–1571.
Yang Z. and Bielawski J.P. 2000. Statistical methods for detecting molecular adaptation. Trends Ecol. Evol. 15: 496–502.
Yang Z., Swanson W.J., and Vacquier V.D. 2000. Maximum-likelihood analysis of molecular adaptation in abalone sperm lysin reveals variable selective pressures among lineages and sites. Mol. Biol. Evol. 17: 1446–1455.
|


