Measuring Distortions in the Pattern of Neutral Variation
If a favorable mutation fixes in the population or if the population has increased in size following a population bottleneck, then the genealogy will look like a star; that is, ancestral lineages will tend to coalesce during the brief selective sweep or at the population bottleneck. Subsequent mutations will therefore be found only in a single lineage and there will be an excess of rare variants (Fig. 19.15A). In contrast, if population size is constant, then most coalescence events will occur much more recently than the common ancestor and so mutations will tend to be represented several times in the sample (Fig. 19.15B).
How can we measure such distortions in the pattern of neutral genetic variation? The most widely used approach is to compare different estimates of the fundamental parameter, θ = 4Neµ. One estimate, θπ, is given by the nucleotide diversity π, which is just the average proportions of sites that differ between a random pair of sequences. (For a random mating diploid organism, this is just the heterozygosity; see Chapter 13 [p. 363].) Watterson (1978) proposed an alternative estimate θW, which is proportional to the number of segregating sites seen in the sample. Under the neutral theory, these two estimates are expected to be equal (θπ = θW). Therefore, Tajima (1989) suggested that distortions from neutrality could be measured by a statistic D, which is equal to the difference between them divided by the standard deviation (s.d.) of this difference, D = (θπ – θW)/s.d. Rare variants will count toward the number of segregating sites, but will contribute little to pairwise differences. Thus, an excess of rare variants leads to negative values of D.
Both population bottlenecks and selective sweeps lead to negative Tajima’s D. However, the effects of a selective sweep can be distinguished if an outgroup is available, so that the direction of changes can be determined. Fay and Wu (2000) proposed using an estimate θH, which is proportional to the homozygosity of derived mutations (i.e., to mutations that occurred in the ancestry of the sample in question and that are not found in the outgroup). θH is equal to θπ and θW under the standard neutral theory, but is larger if a selective sweep has carried derived mutations to high frequency. Thus, a statistic H = (θπ – θW)/s.d., analogous to Tajima’s D, can be used specifically to detect selective sweeps that have recently finished (Fig. 19.23).
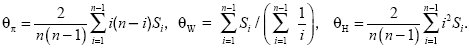
The alternative measures of diversity, θπ, θW, and θH, can be calculated from a list, Si, of the number of variants that appear 1, 2, 3, ... times in the sample in a sample of n genes. For example, in Figure WN19.3A, S1 = 4, S2 = 2, S3 = 5; in Figure WN19.3B, S1 = 11; and in Figure WN19.3C, S1 = 5, S2 = 1, and S4 = 5; n = 6. Then
The three estimates θπ, θW, and θH are shown in the simulation of Figure WN19.4. Near the selected locus, there is almost no variation and so all three are near to 0. At the edges of this region, there is some variation, and as expected θH is substantially increased, because the selective sweep has raised previously rare variants to unexpectedly high frequency (red line). In contrast, θW and θπ (blue and black lines), which determine Tajima’s D, are much less sensitive to the selective sweep. A similar pattern is seen around the Duffy locus (p. 536), where selection has fixed a malaria-resistant allele in West Africa. There, although Tajima’s D is not negative, Fay and Wu’s H statistic is significant, indicating that previously rare variants have hitchhiked to high frequency along with the resistance allele.
|


