Chapter 14 Notes
Variation in Genetically Complex Traits
Introduction to Quantitative Traits
Genes Influence Phenotype through a Complex Web of Interactions
The most successful predictions of protein structure are made by analogy with the known structures of related proteins, not by a priori predictions based on physics alone.
There are many recent reviews of “systems biology,” the quantitative modeling of biological systems (see, e.g., Kitano 2002a,b).
Quantitative Genetics Is Concerned with Variation between Individuals
Ridley (2003) gives a nice discussion of what is meant by a gene “for” a trait.
Most Traits Are Influenced by Many Genes
For estimates of the incidence of diseases caused by defects in a single gene, see Vogel and Motulsky (1997) and Weatherall (1991 [Chapter 2], 2001).
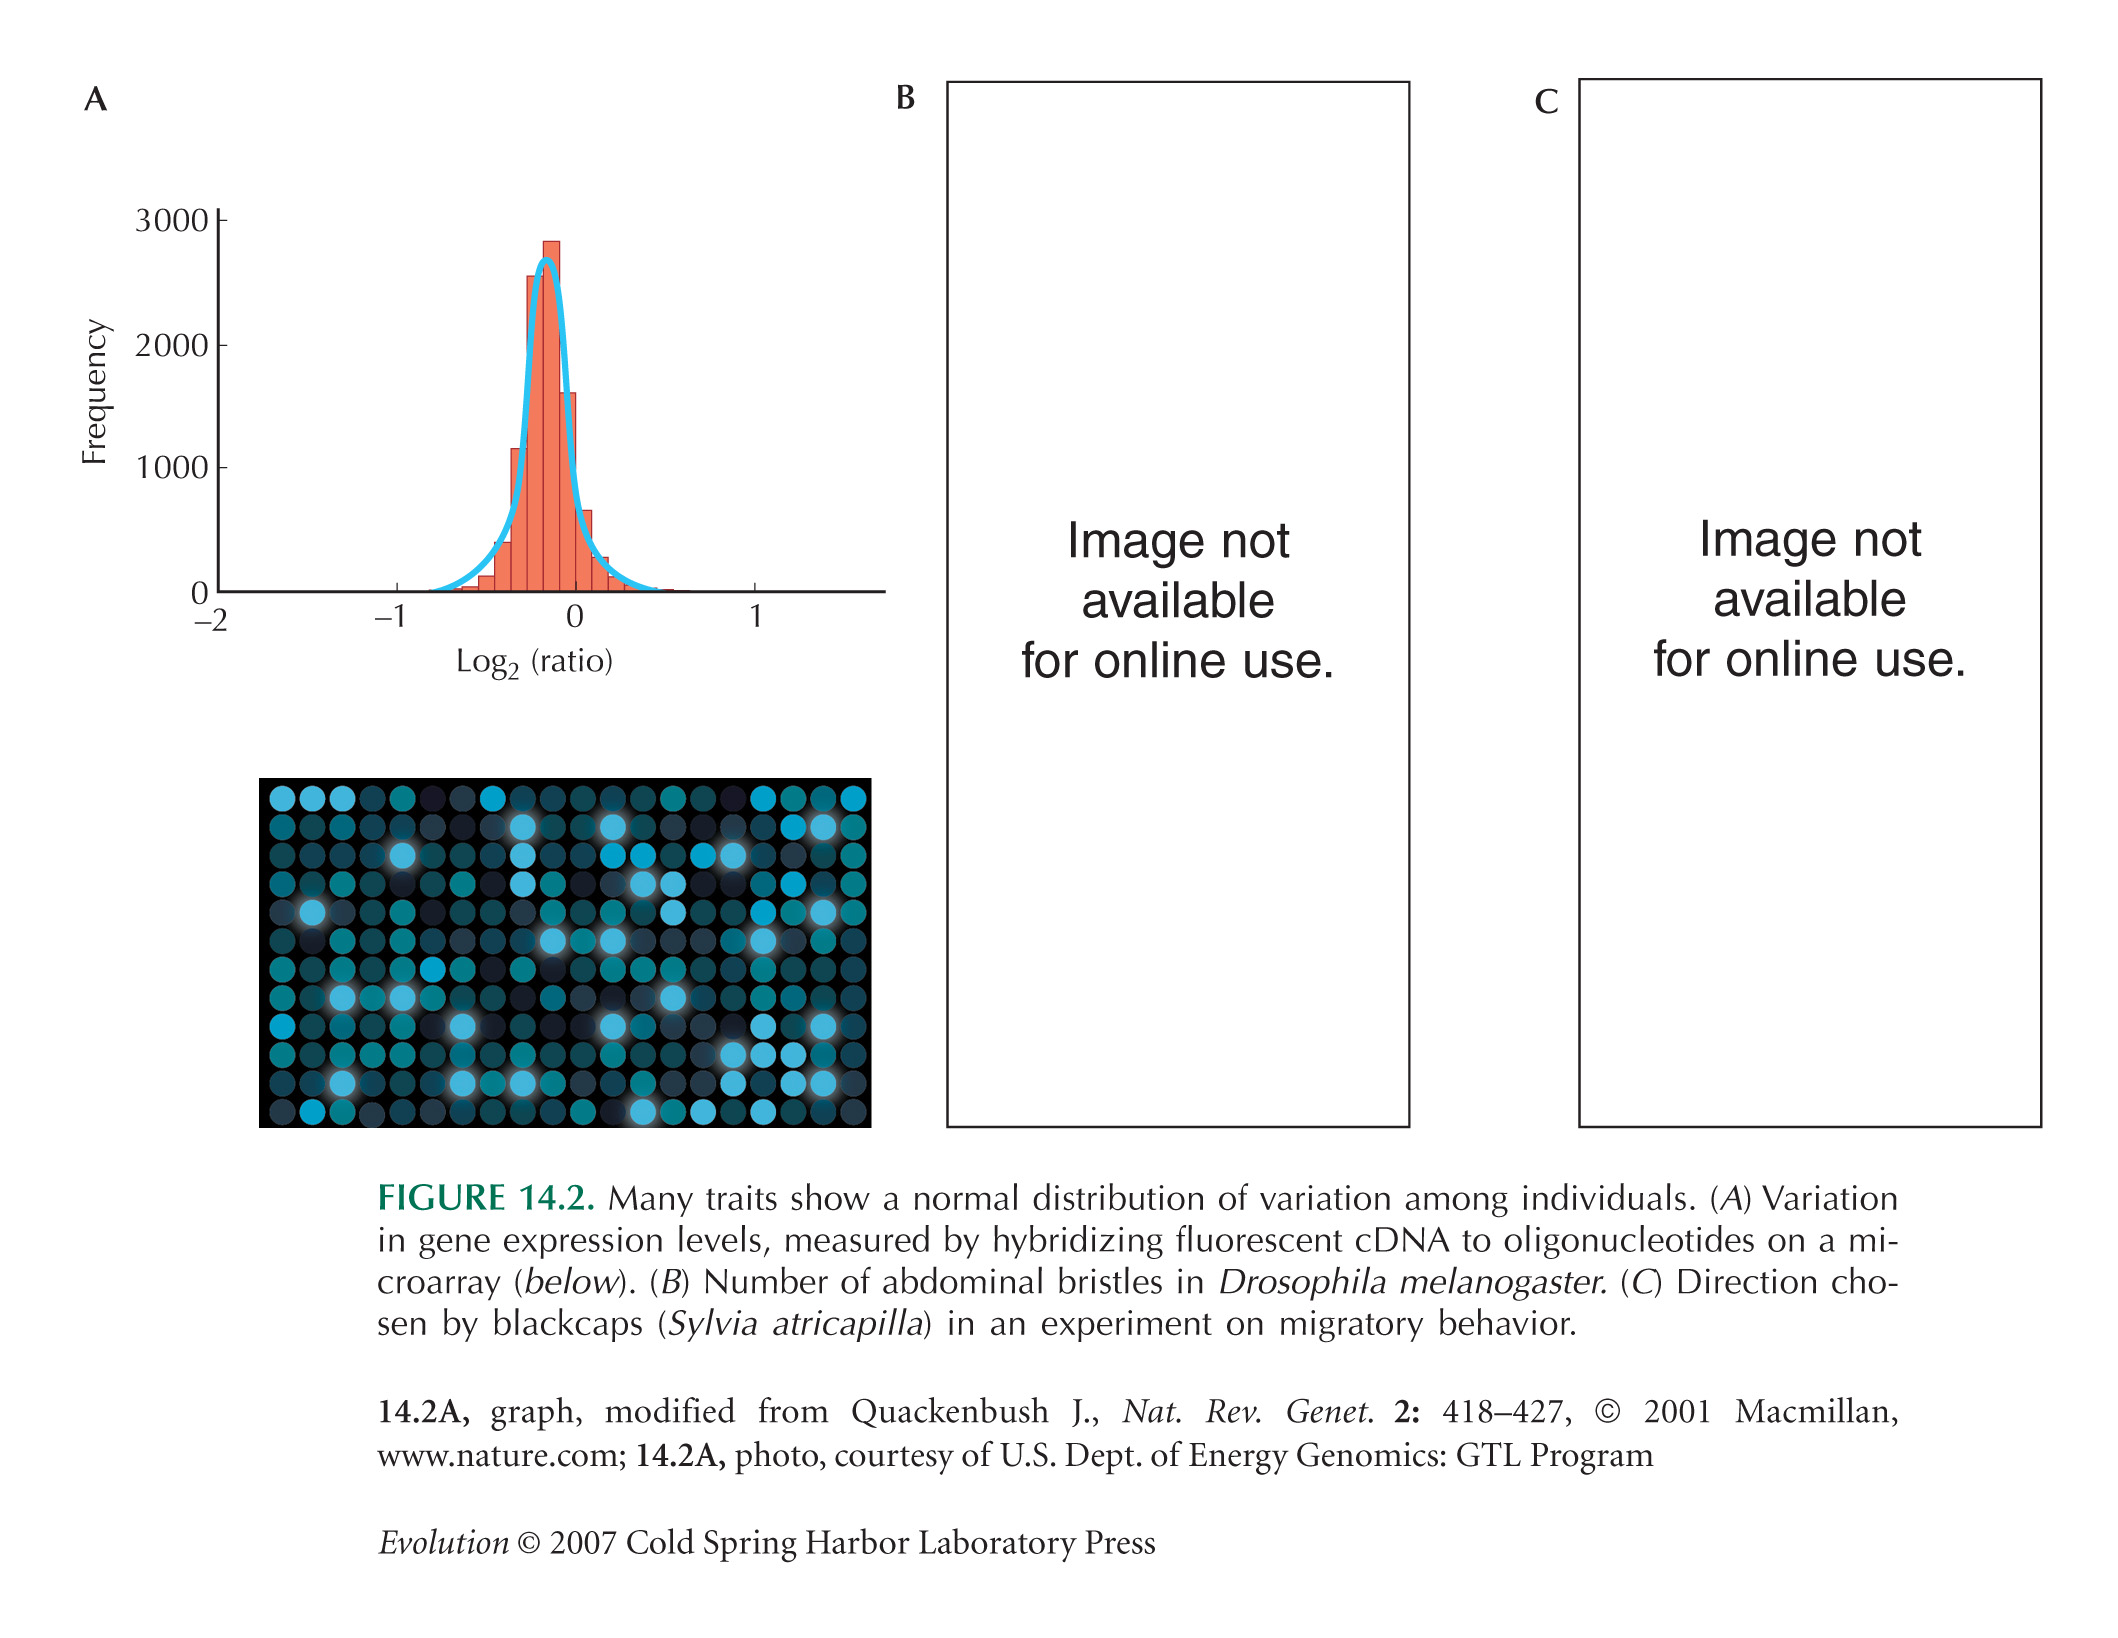
Figure 14.2A (microarray data) is from Quackenbush (2001, Fig. 1a). Figure 14.2B (Drosophila bristles) is from Falconer and Mackay (1995, Fig. 6.2c). Figure 14.2C (blackcap orientation) is from Berthold (2001, Fig. 7.3).
Analyzing Quantitative Variation
Traits Often Follow a Normal Distribution
The distributions of fruit weight shown in Figure 14.3 are from Powers (1950). Although a log transformation gives an approximately normal distribution in this example, Powers showed that no single transformation could make all of the distributions in a crossing experiment (F1, F2, backcross, etc.) normal.
The Normal Distribution Describes Variation in Multiple Traits
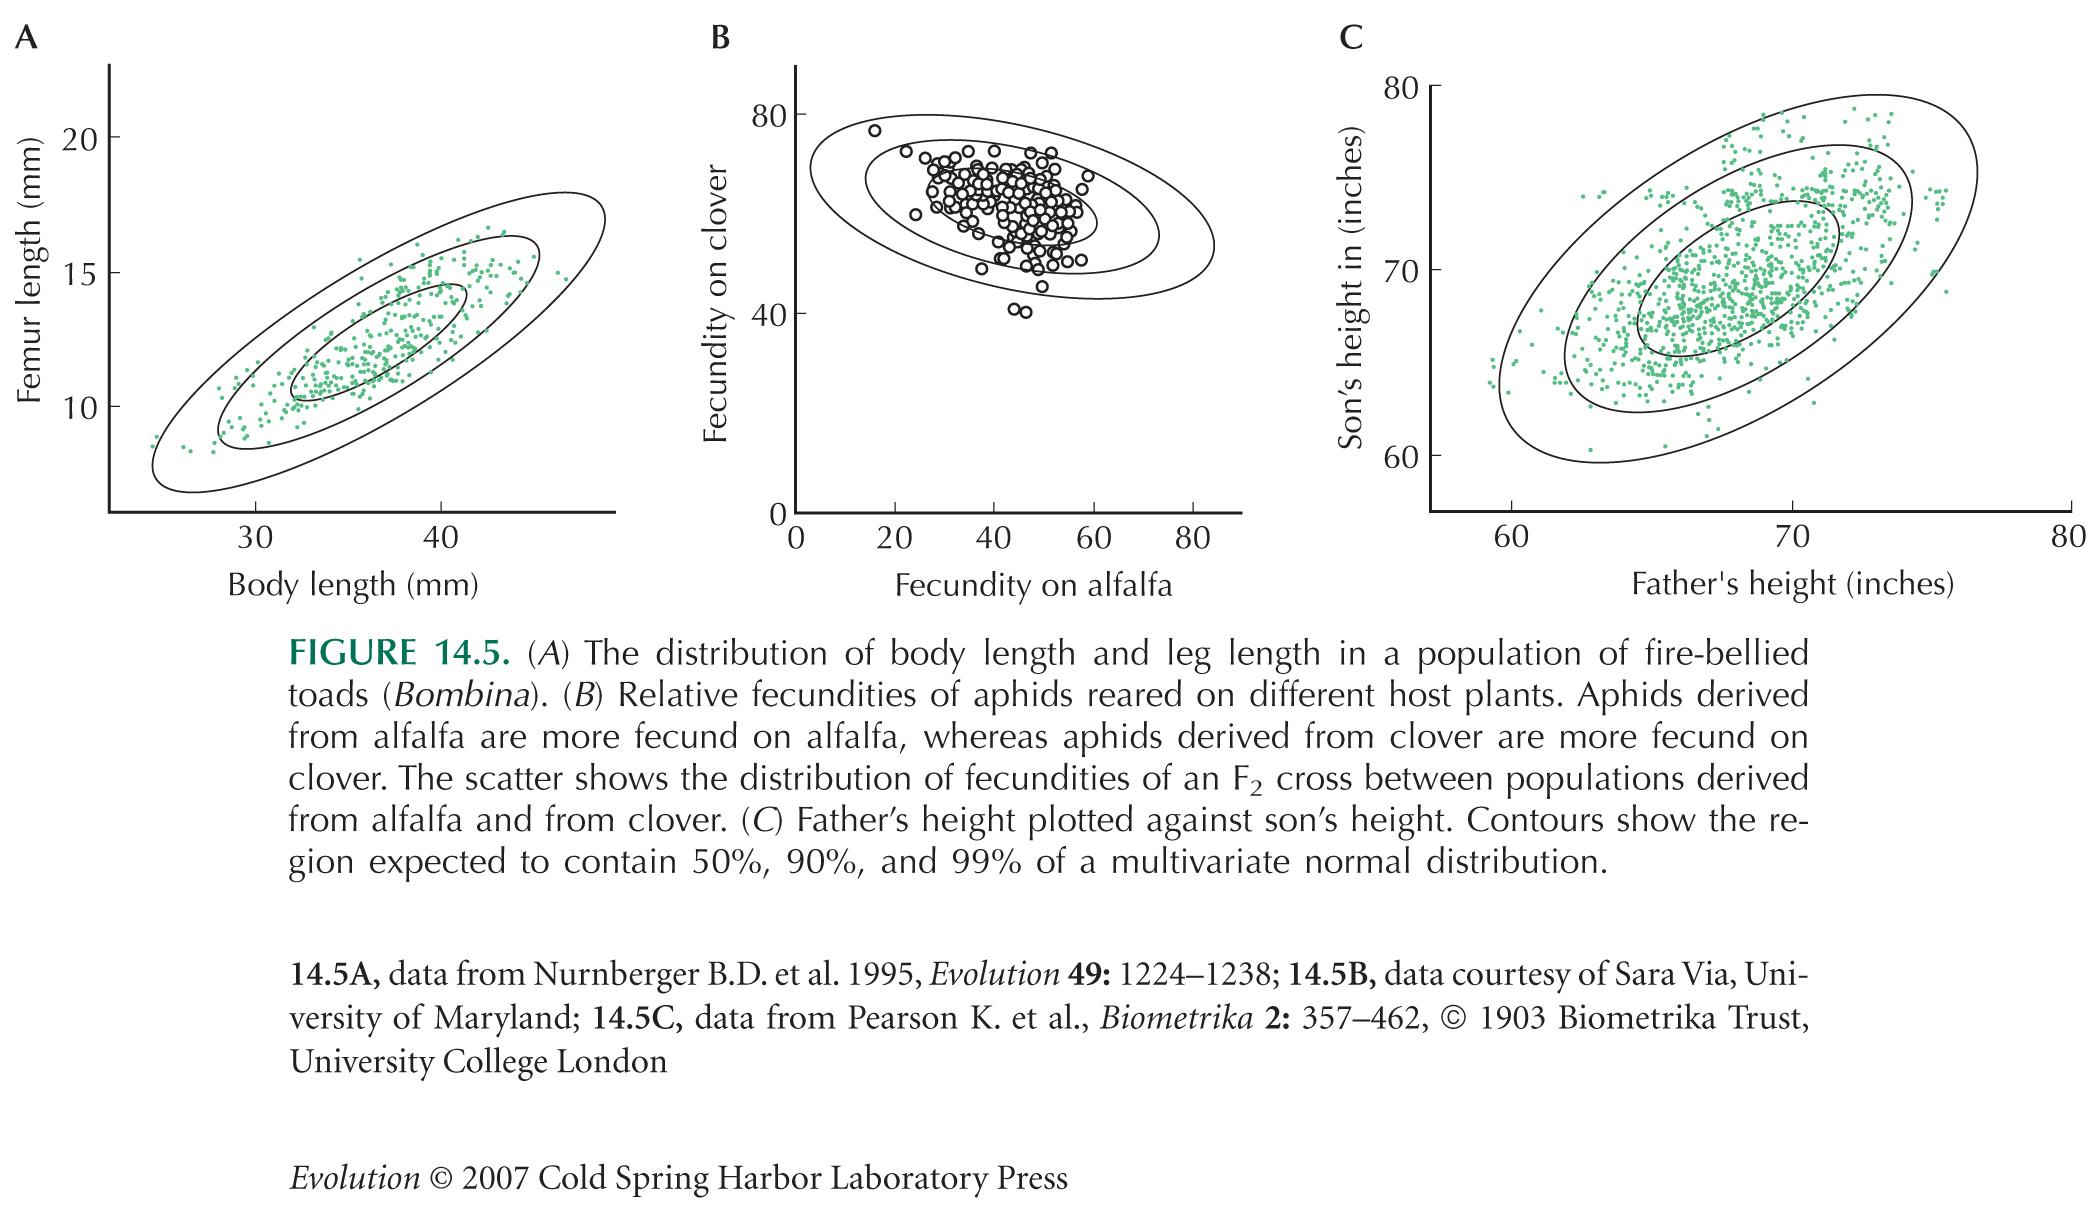
Figure 14.5A uses data from Nürnberger et al. (1995). Figure 14.5B (courtesy of Sara Via) is from Via and Hawthorne (2002). Figure 14.5C uses a classic data set from Pearson and Lee (1903).
In the example of Figure 14.5B, the value of a trait (fecundity) in two different environments is shown. In general, the way that a trait varies across environments is known as the reaction norm (p. 705). The consequences of this kind of interaction between genotype and the environment have received considerable attention over recent years. For reviews, see Falconer and Mackay (1995) and Pigliucci (2001).
In general, the distribution of any number of traits can be represented by a normal distribution, which is defined by the means of the traits, by the variances of the traits, and by the covariance between each pair of traits. The latter two are written as a covariance matrix. For instance, the covariance matrix for the example of Figure 14.5A would be written as

Genes Interact through Dominance and Epistasis
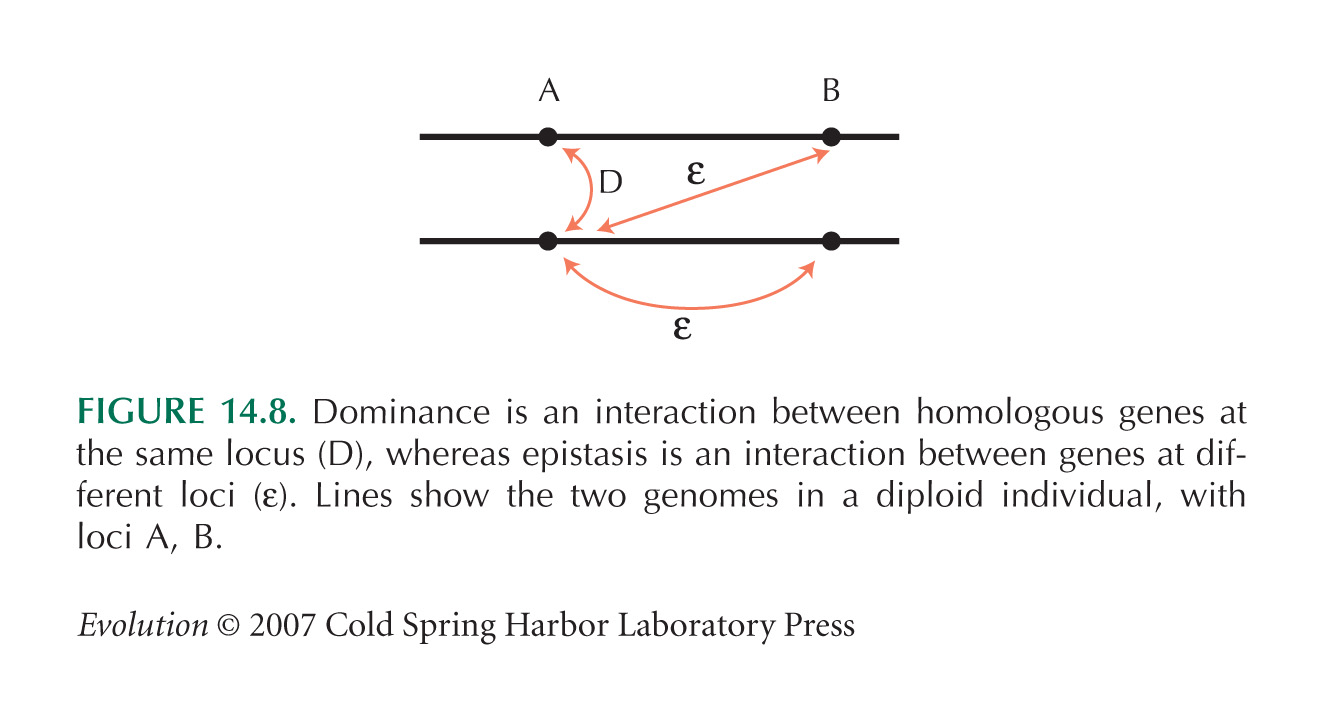
Figure 14.8 is from Clark and Wang (1997).
With Dominance or Epistasis, the Effect of a Gene Depends on Its Genetic Background
Lynch and Walsh (1998, p. 71) and Falconer (1985) give a more detailed discussion of the distinction between average effect and average excess.
Box 14.1 Calculating Components of the Genetic Variance: Sickle-Cell Hemoglobin in Humans
Data for this example are from Allison (1956, 1964).
The heritability here is calculated assuming that heterozygotes all survive. If heterozygotes actually have a probability x < 1 of surviving, then the mean survival in the population is 0.855x, and the phenotypic variance is 0.855x(1 – 0.855x). The genotypic and additive genetic variances (VG, VA) will be multiplied by x2, because the breeding value A and genotypic values G will be multiplied by x. Thus, the heritability will decrease as overall survival decreases.
Quantitative Genetics Describes Interactions among Any Number of Genes
The average excess for pairs of genes can be defined as follows: Find the average trait value of individuals carrying a particular pair of alleles and then subtract both the overall mean and the average excesses of each allele taken separately. This gives a measure of the effect of that pair of alleles, over and above their individual effects. This procedure can be extended to any number of genes.
Classical population genetics deals with interactions between genes (i.e., epistasis and dominance) in an elegant way, provided alleles are combined at random in the population. However, matters become very much more complicated in the presence of associations between alleles. (Such associations are known as linkage disequilibrium and are discussed in Box 15.5.) Then, the average excess and average effect of alleles depend not just on the causal influence of the allele on the trait, but also on its associations with other alleles that have a causal effect. Thus, an arbitrary marker can be correlated with the trait. Indeed, mapping QTL using either crosses or population-level association studies relies on the presence of such linkage disequilibria.
Causes of Variation Can Be Separated from Each Other
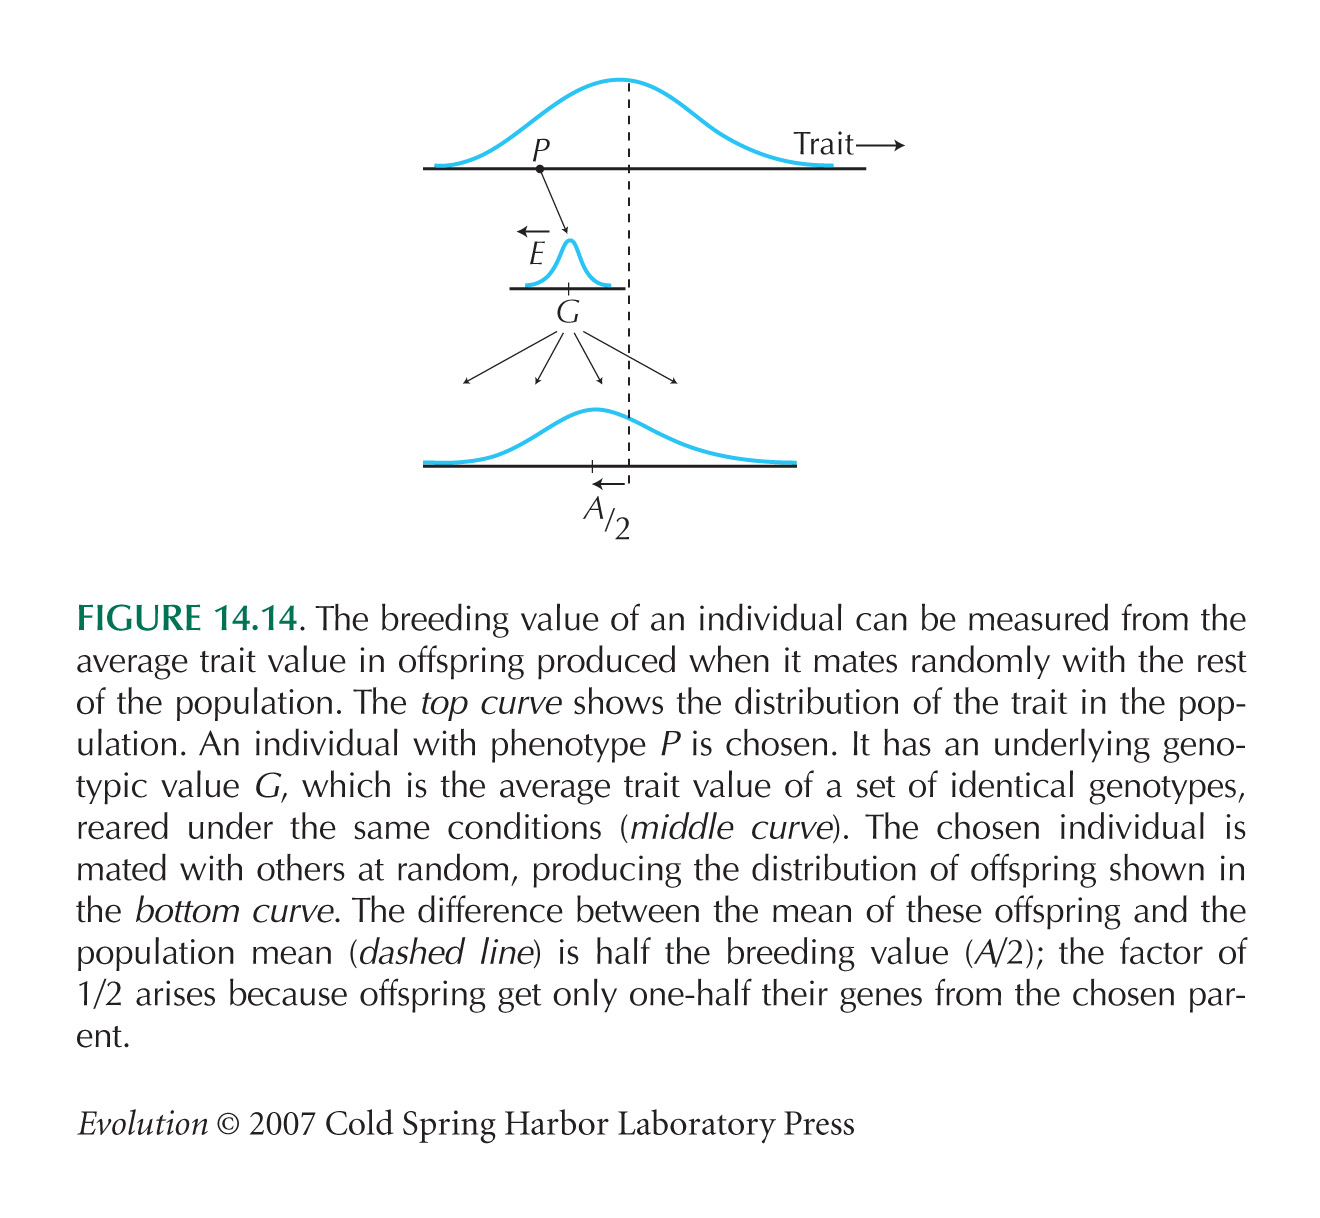
The concrete relationship between breeding value and the mean of offspring produced by random mating (Fig. 14.14) only holds with no epistasis. Otherwise, offspring will carry some combinations of alleles from the parents, and so epistatic interactions will contribute.
Variance Components Are Estimated by Comparing Relatives
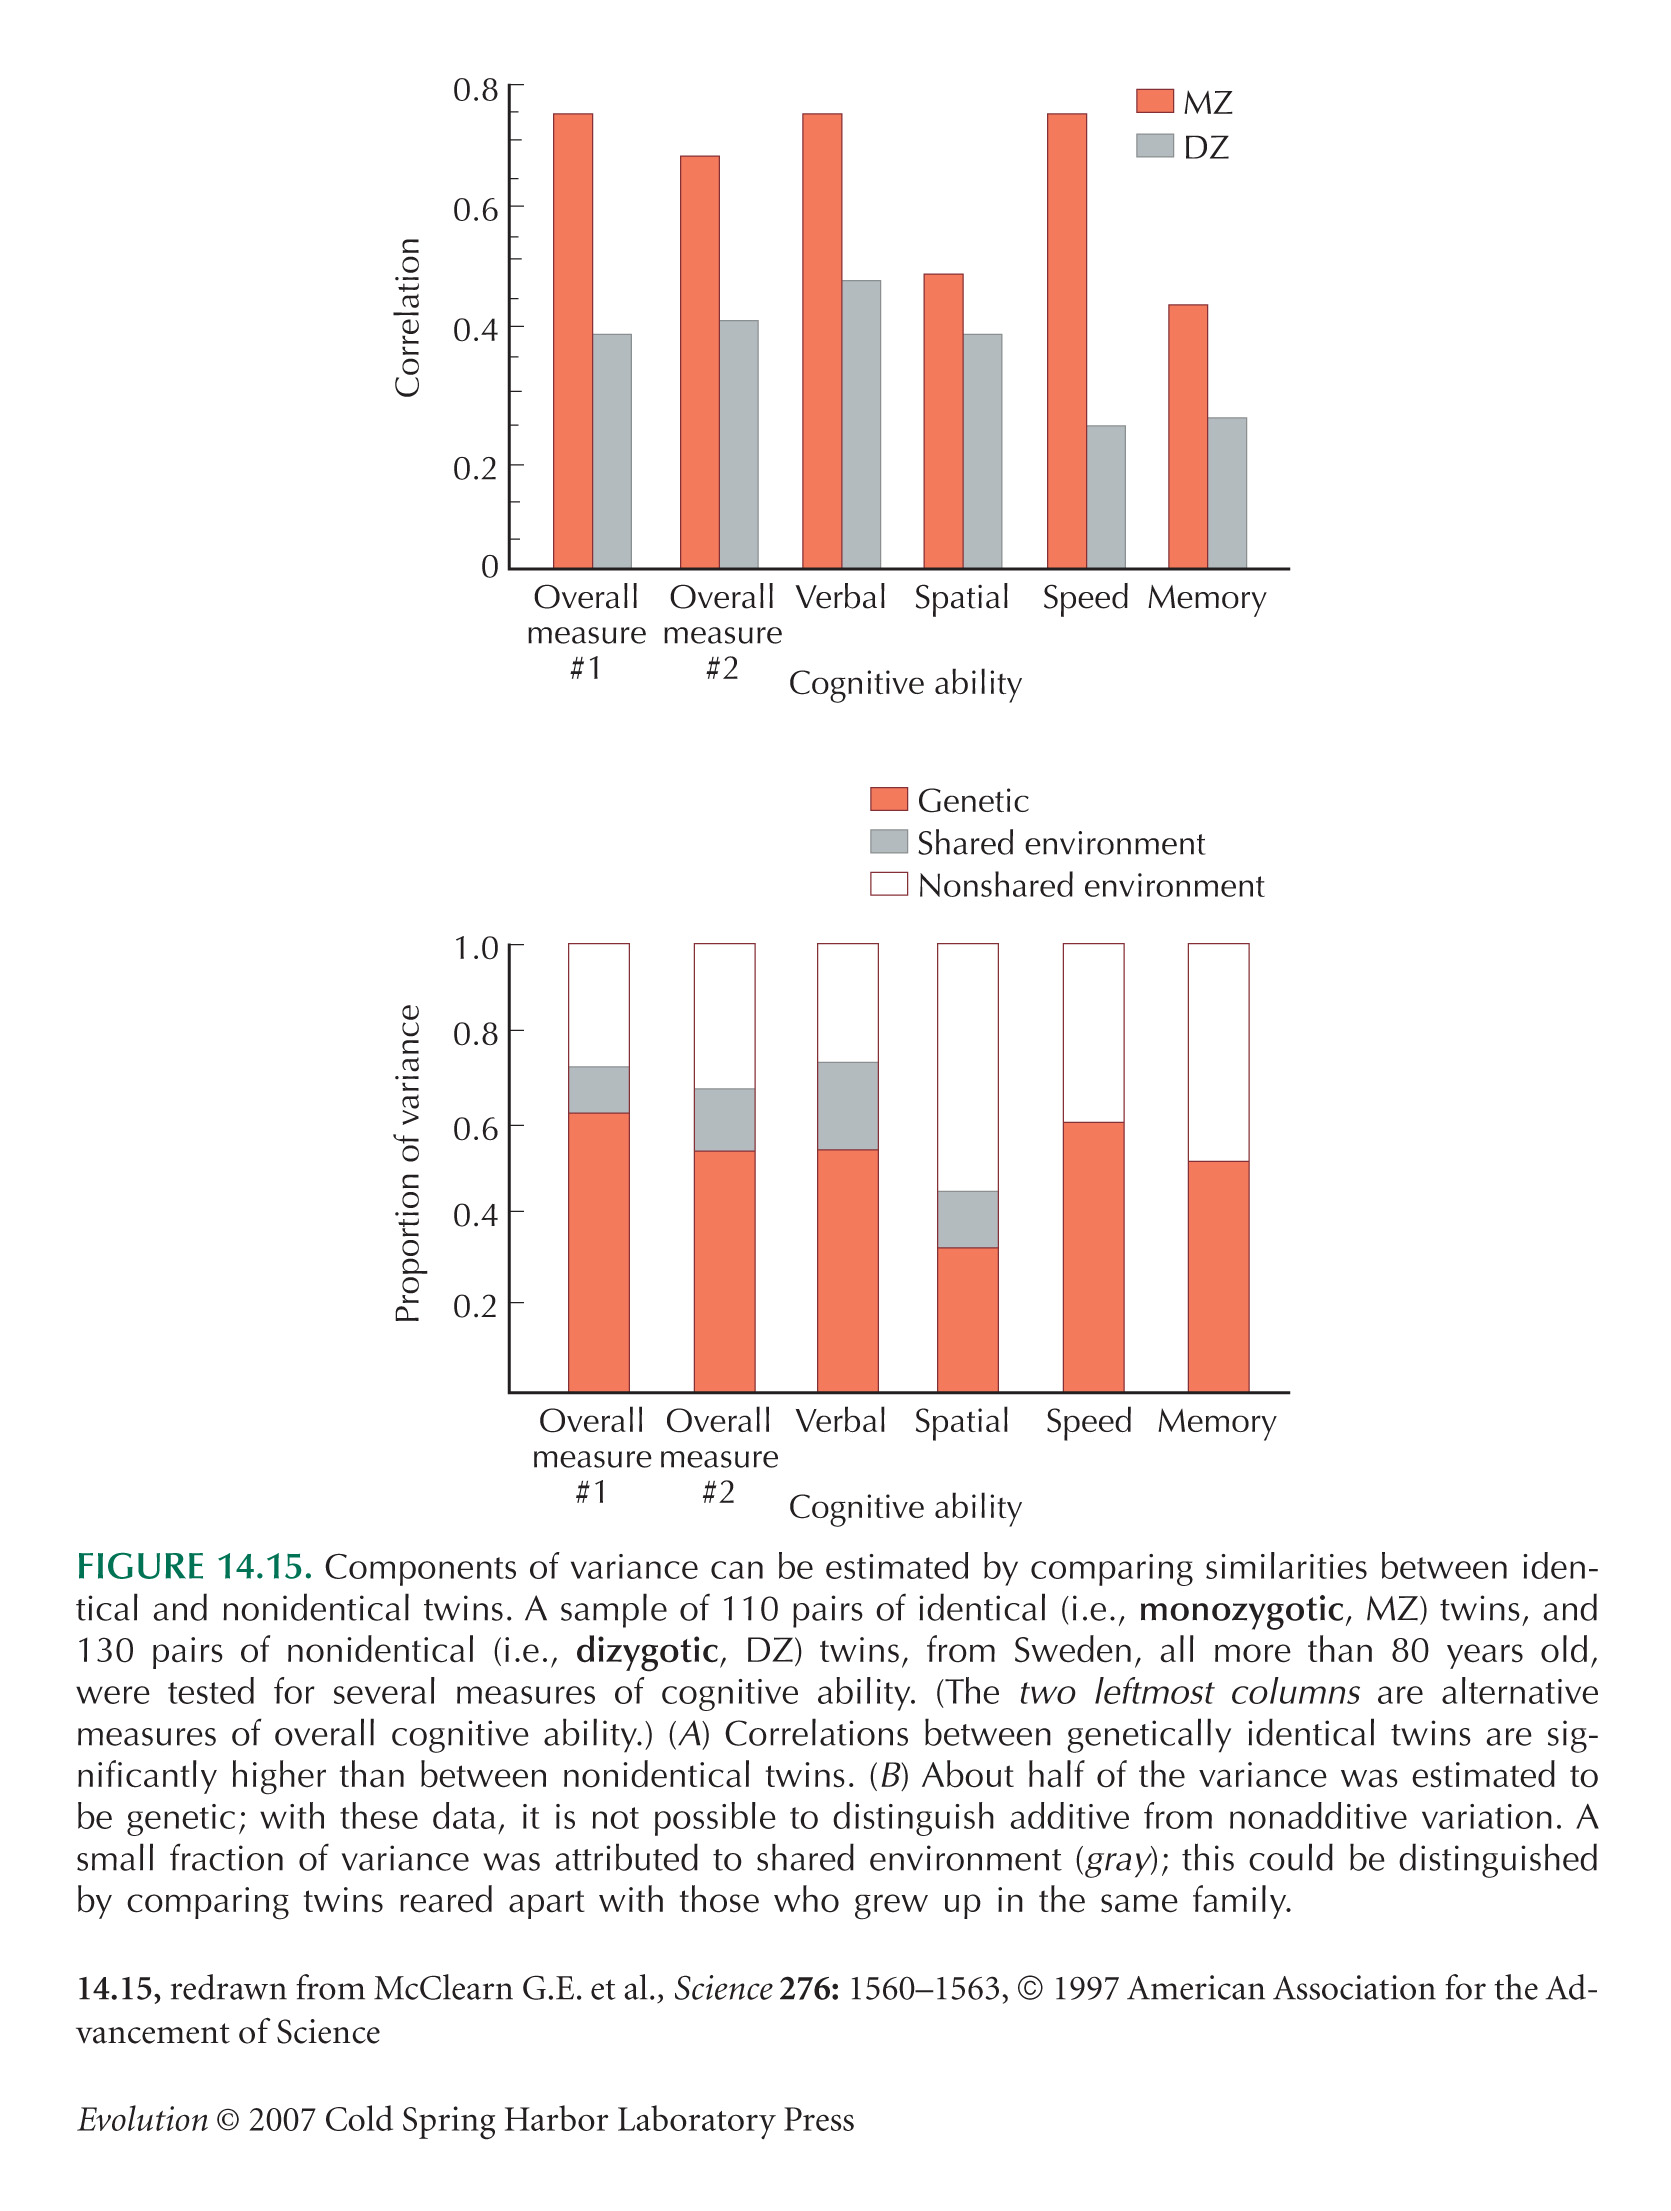
Figure 14.15 is from McClearn et al. (1997).
Estimating Variance Components Is Difficult in Practice
Lynch and Walsh (1998, Section III) provide a comprehensive reference on statistical methods for estimating variance components.
Falconer and Mackay (1995, p. 127) discuss why variance may be mostly additive, even when alleles are recessive.
There Is Extensive Inherited Variation in Most Traits
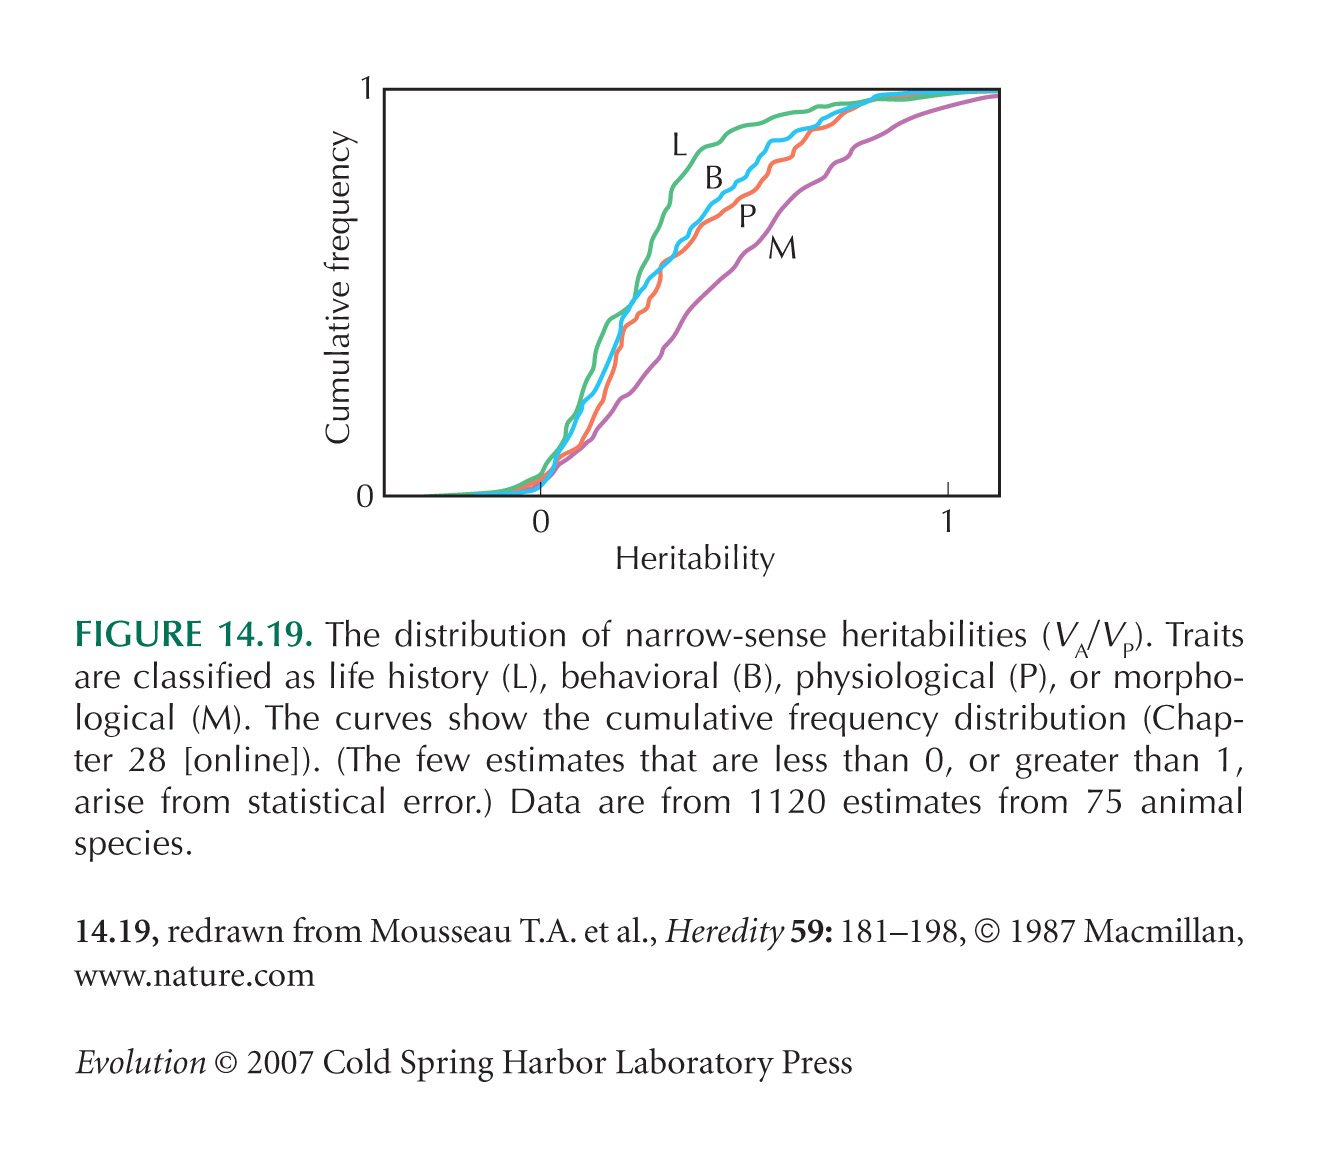
Figure 14.19 is from Mousseau and Roff (1987). Roff (1997) gives an overview of quantitative variation in nature.
The heritability of various traits, including finger-ridge count, is reviewed in Tables 19.2 and 19.3 of Lynch and Walsh (1998).
Maynard Smith and Sondhi (1960) found no response to selection for left–right asymmetry of bristle pattern in Drosophila. The degree of random asymmetry increased, but left- and right-skewed patterns were equally frequent.
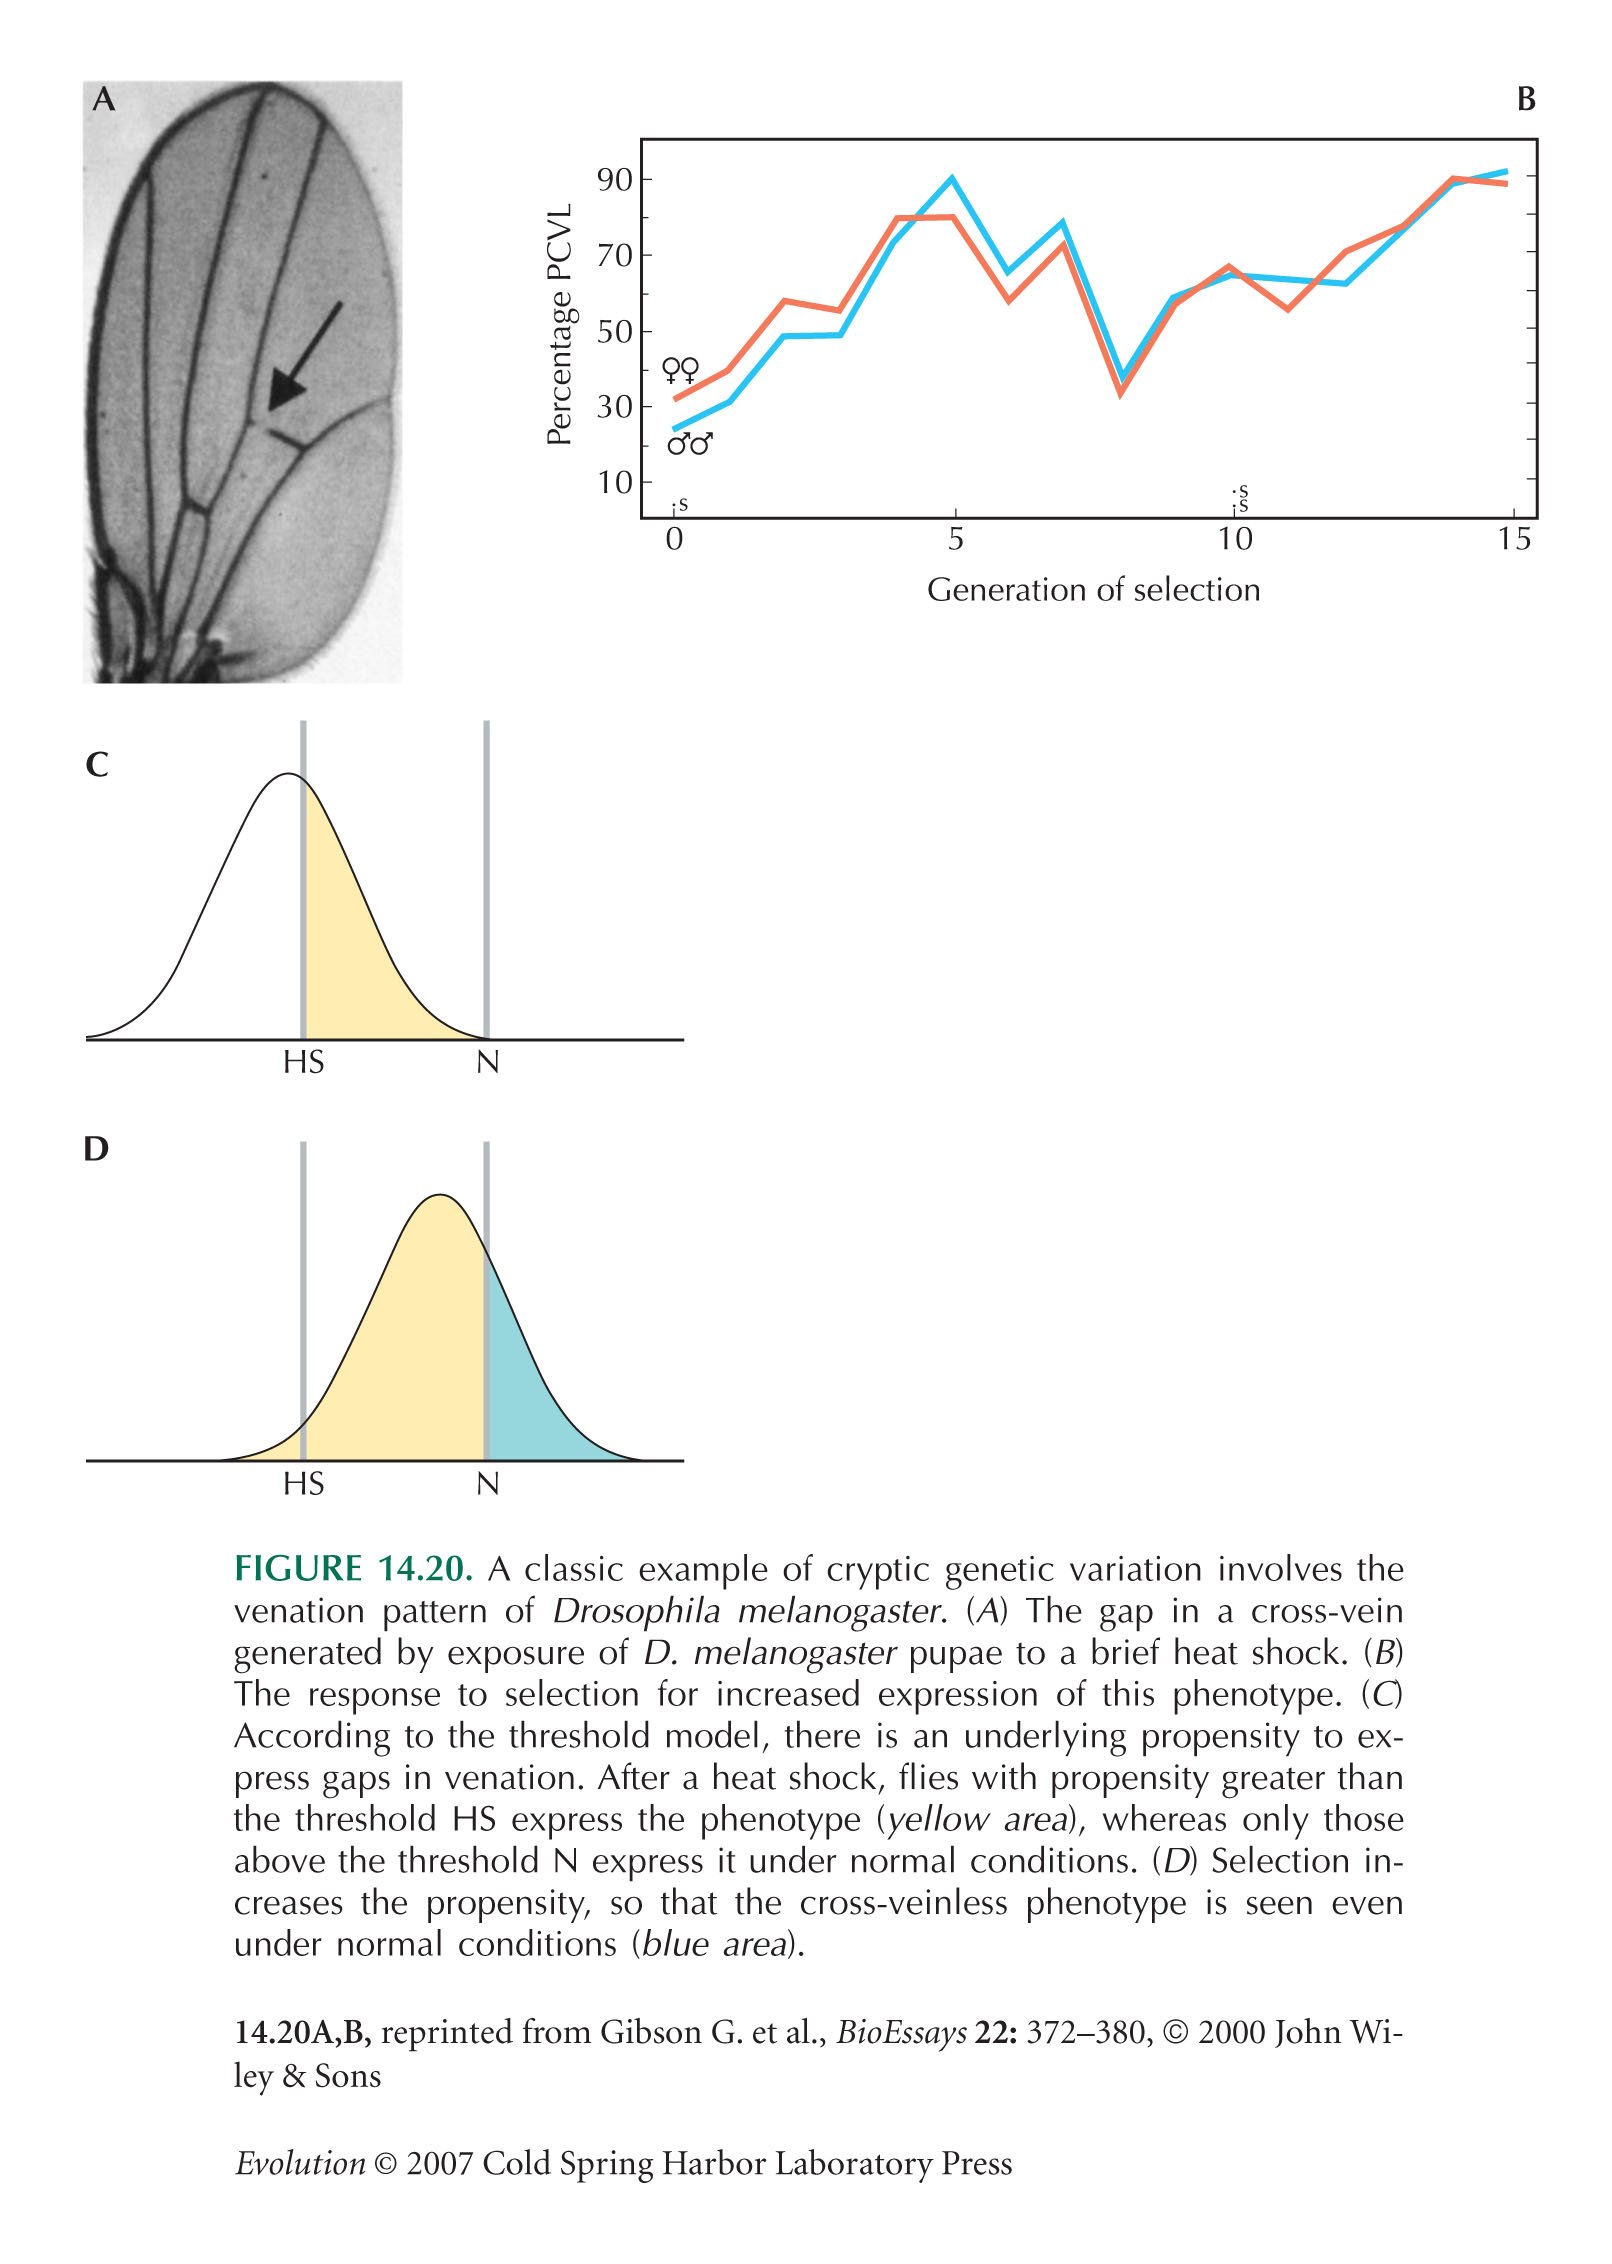
Waddington (1942) introduced the term genetic assimilation. Scharloo (1991) and Rutherford (2000) review the early literature.
The example of Figure 14.20 is from Waddington (1957, Fig. 35); see Gibson and Wagner (2000, Fig. 2).
It Is Hard to Measure the Components of Natural Genetic Variation and the Numbers of Genes Involved
Houle (1992) first pointed out that the low heritability of fitness-related traits is due to their high environmental variance rather than to a low genetic variance.
Lande (1981) and Zeng et al. (1990) discuss the Wright–Castle estimator of gene number. The same idea is the basis of Beadle’s argument that the small fraction (~1/250) of parental phenotypes among F2 plants in a cross between maize and teosinte implied that four or five genes were responsible for their differences (p. 314).
The ratio between the additive genetic variance and the square of the trait mean (VA/ 2) is sometimes termed the evolvability of the trait, because it is a dimensionless measure of how rapidly the trait can respond to selection. However, this is a sense different from that used in Chapter 23 (pp. 689–692). 2) is sometimes termed the evolvability of the trait, because it is a dimensionless measure of how rapidly the trait can respond to selection. However, this is a sense different from that used in Chapter 23 (pp. 689–692).
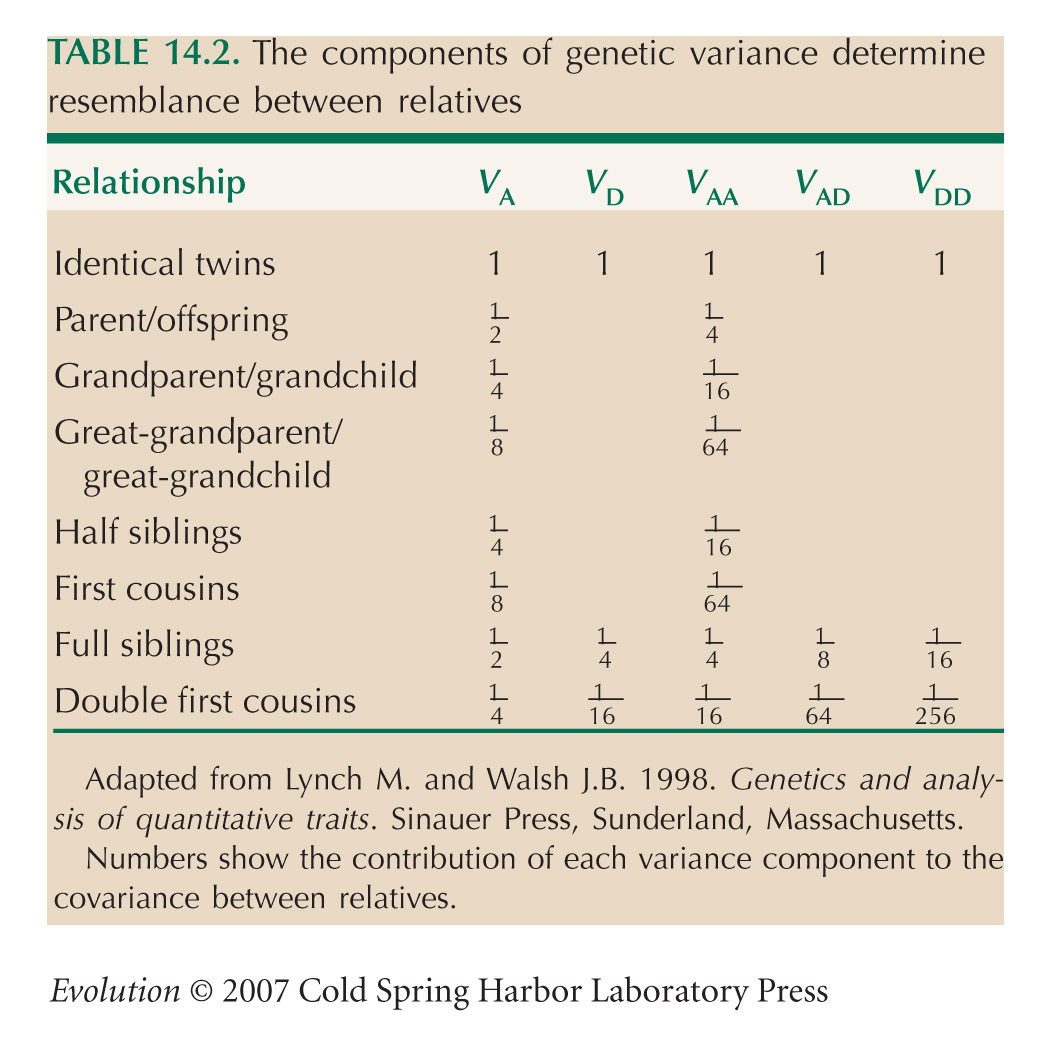
Information about components of genetic variance is hard to obtain. Estimation of dominance and epistatic variance requires large samples of individuals, with different kinds of relationships (Table 14.2). Moreover, estimates for natural populations are often confounded, because relatives share environments as well as genes. Genetic variance in the well-studied trait, bristle number in Drosophila, is almost entirely additive, and, in general, morphological traits of this kind have mainly additive variance. In contrast, about half of the genetic variance in life-history traits is nonadditive (see pp. 548–549). Crnokrak and Roff (1995) review the degree of additivity of different kinds of traits.
The Genetic Basis of Quantitative Variation
Classical Genetics Can Identify Quantitative Trait Loci
The first attempts to map QTLs, using Mendelian markers, were by Payne (1918) and Sax (1923).
Lynch and Walsh (1998, Section II) give a comprehensive review of the statistical methodology for finding QTLs. Falconer and Mackay (1995, Chapter 21) give a succinct introduction. Mackay (2001a,b) reviews the Drosophila literature.
Olsen et al. (2005) provide an example of a very large-scale QTL analysis in dairy cattle.
Box 14.3 Mapping Quantitative Trait Loci
Here, we assume that the rate of recombination between markers A, B is the sum of the rates between A and B, B and C (i.e., cAC = cAB + cBC for B between A and C). This is a good approximation if linkage is tight (cAC << 1).
Methods for mapping QTLs using multiple markers are explained in . Further details can be found in Lynch and Walsh (1998).
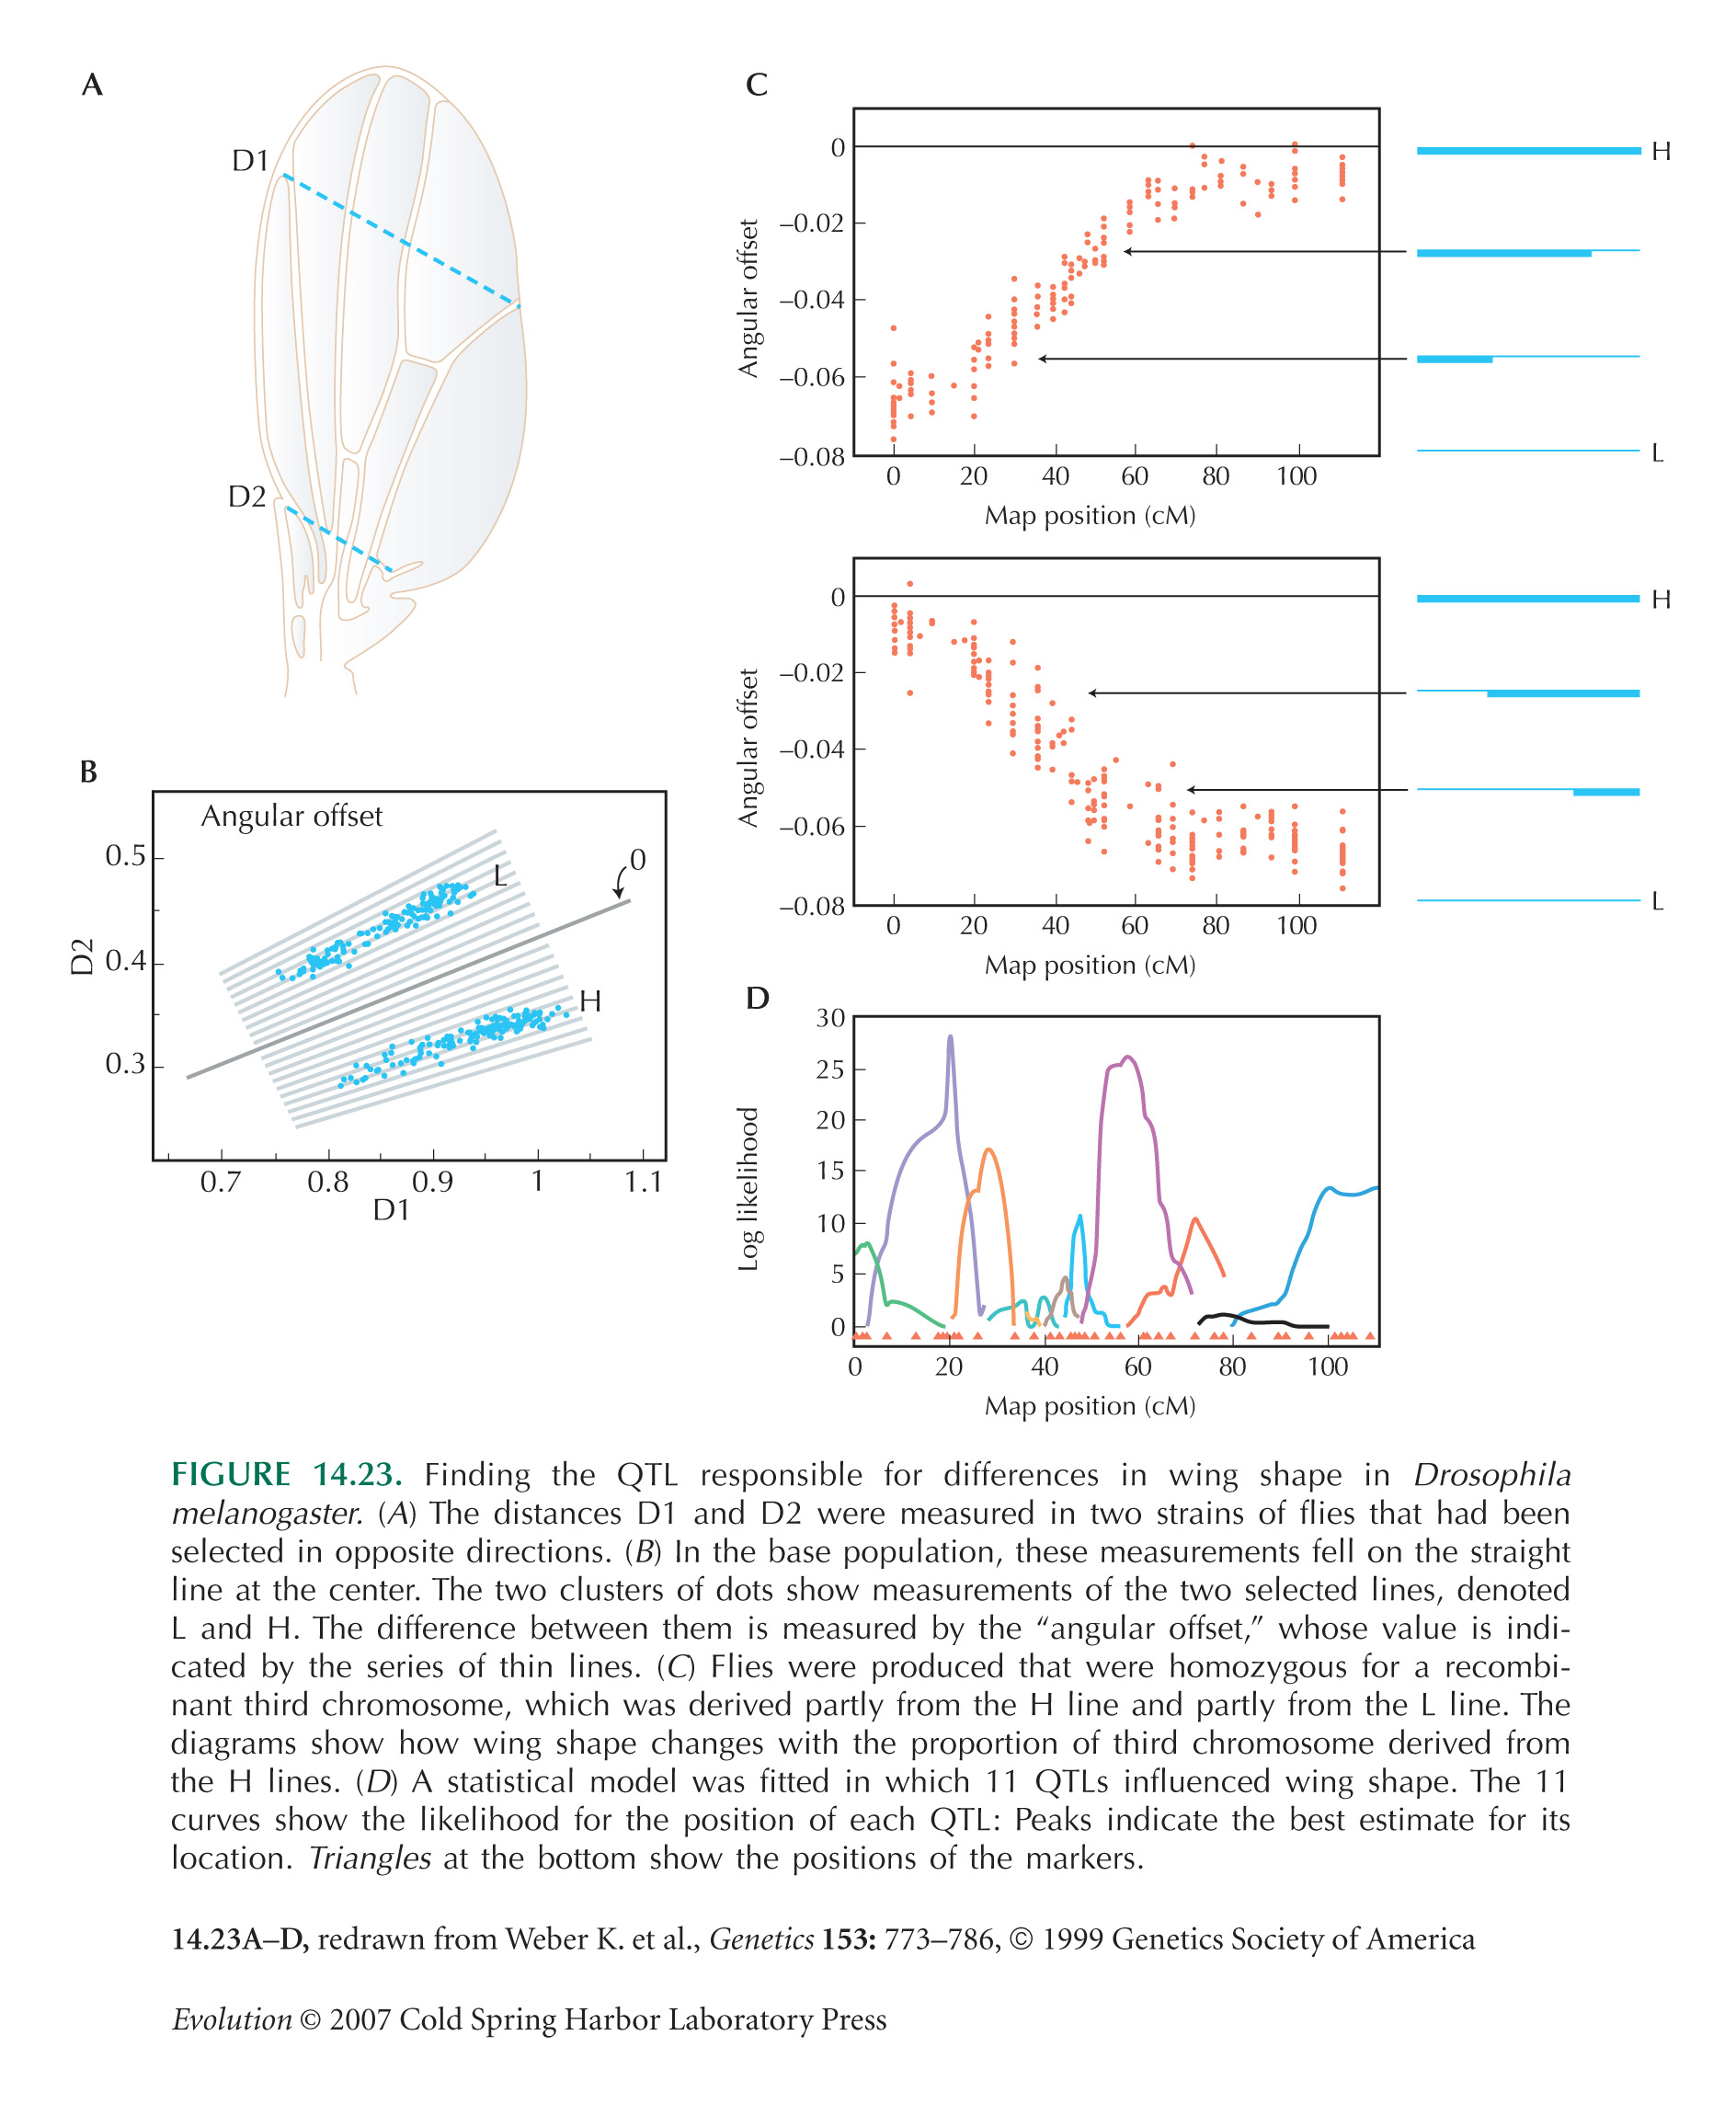
The Principles of QTL Mapping Are Illustrated by a Study of Differences in Wing Shape in Drosophila
The example in Figure 14.23 is from Weber (1990) and Weber et al. (1999, 2001).
It Is Difficult to Find the Precise Position of QTLs
The overestimation of QTLs that are at the threshold of significance are sometimes known as the Beavis effect, after Beavis (1994).
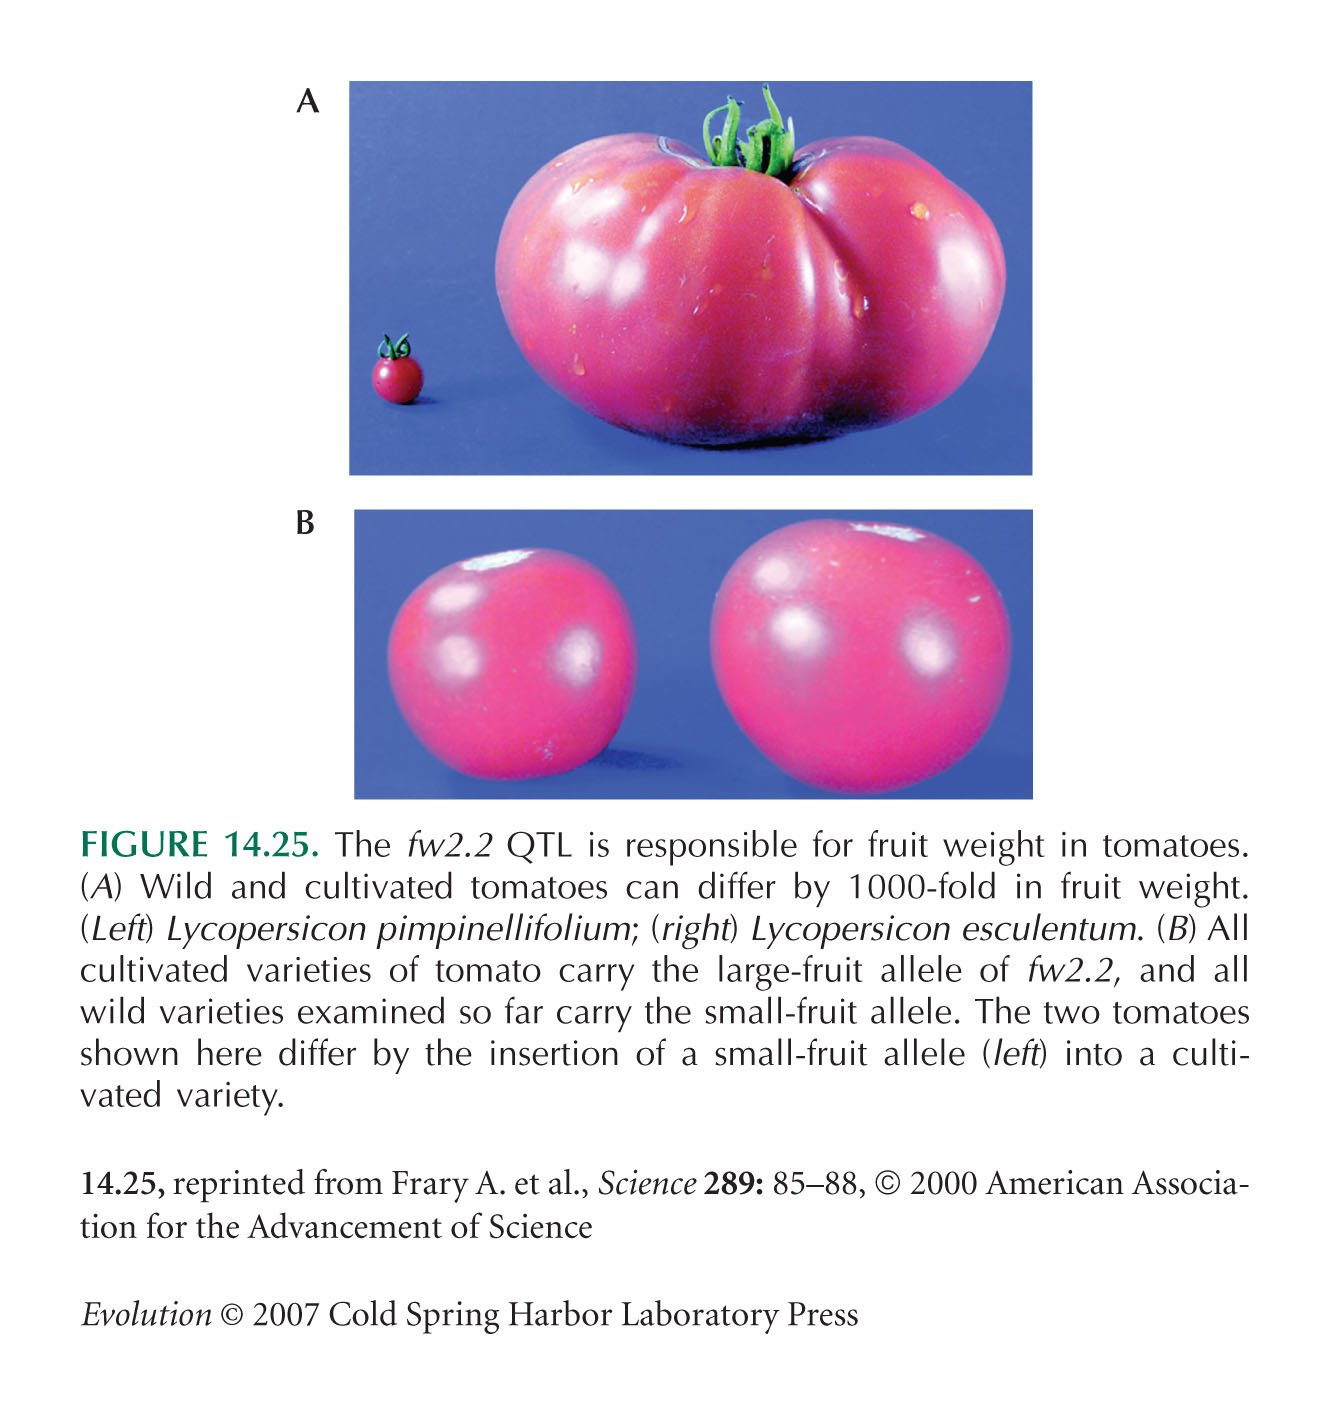
The example in Figure 14.25 is from Frary et al. (2000). The description in Figure 14.24 is slightly simplified: There was an extra stage of localization, using the degree of overlap of six different yeast artificial chromosomes (YACs). Another complication is that recombination rates are much lower in the interspecific cross, which makes centiMorgans a problematic measure of distance.
Recent examples of precise location of QTLs are reviewed by Flint et al. (2005) and Glazier et al. (2002). Korstanje et al. (2002) show how the number of identified QTLs is accelerating rapidly. Flint et al. (2005) emphasize that most QTLs that have been precisely located to date have exceptionally large effect sizes and that it is very difficult to move from a typical QTL to the causative variant.
Mutations with Major Effects on a Trait Show Us Which Candidate Genes Are Likely to Influence Milder Variation
Doebley (2001) reviews how the gene teosinte branched 1 was shown to be responsible for a substantial part of the difference between maize and its wild relative, teosinte. Beadle (1939) first proposed that four to five genes were responsible for the differences between maize and teosinte, but the hypothesis that maize originated by selection on teosinte was not widely accepted until recently. Doebley and Stec (1991, 1993) and Doebley et al. (1995) showed that five regions of the genome were responsible for the major differences between teosinte and maize; one of these regions included the candidate gene tb1. (Beadle became much better known for his work on the biochemical genetics of Neurospora, which led to the “one gene, one enzyme” hypothesis [p. 4].) See pp. 313–318.
A QTL can be identified with a candidate gene by using the same complementation test that is used to define Mendelian genes (Box 13.1). This is explained in . For an example, see p. 315.
Associations between Genetic Markers and Quantitative Traits in the Population as a Whole Can Help Map QTLs
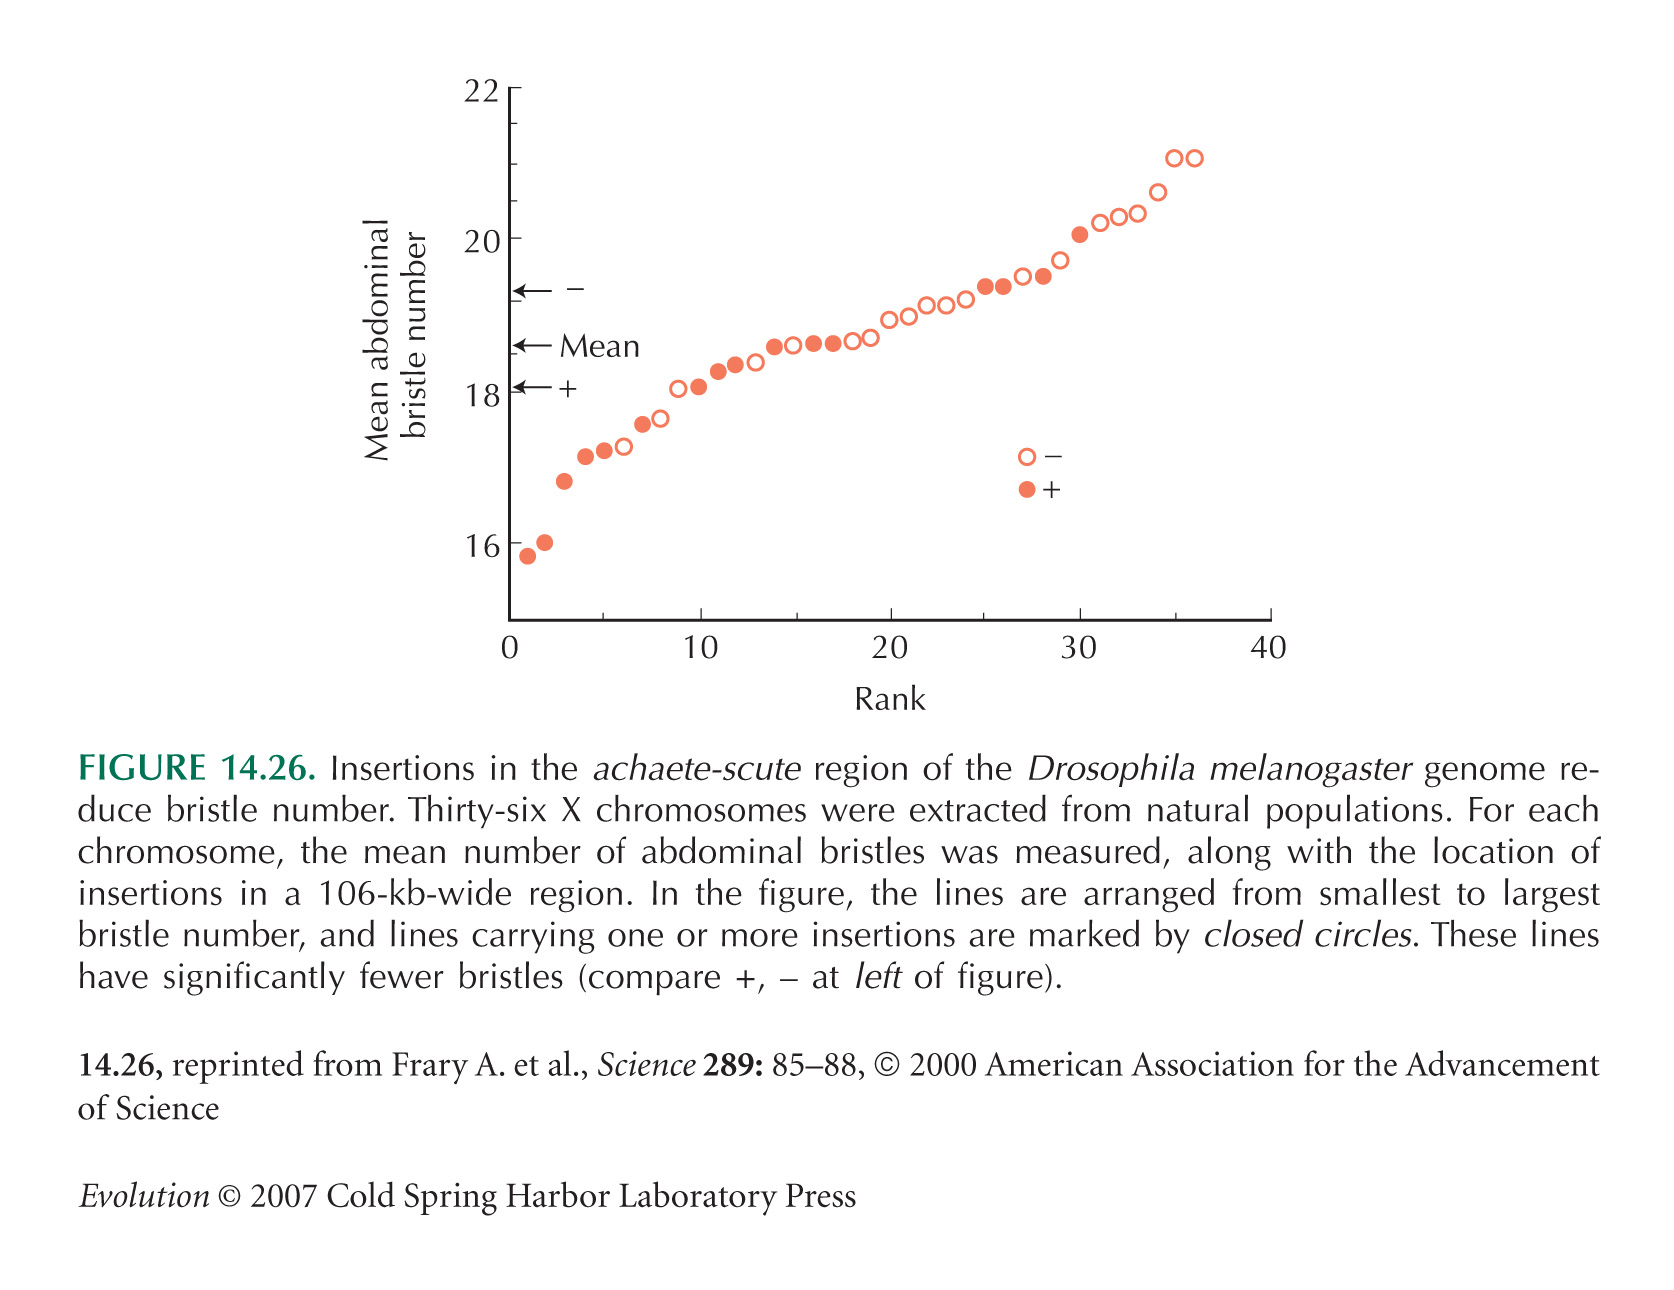
Figure 14.26 is from Mackay and Langley (1990). Mackay (2001b) reviews studies of associations between candidate genes and bristle number in Drosophila. For further studies, see Long et al. (1995, 1997, 1998).
The technical term for an association between alleles at different loci is linkage disequilibrium (Box 15.5). Association studies rely on linkage disequilibrium between the QTLs and marker loci.
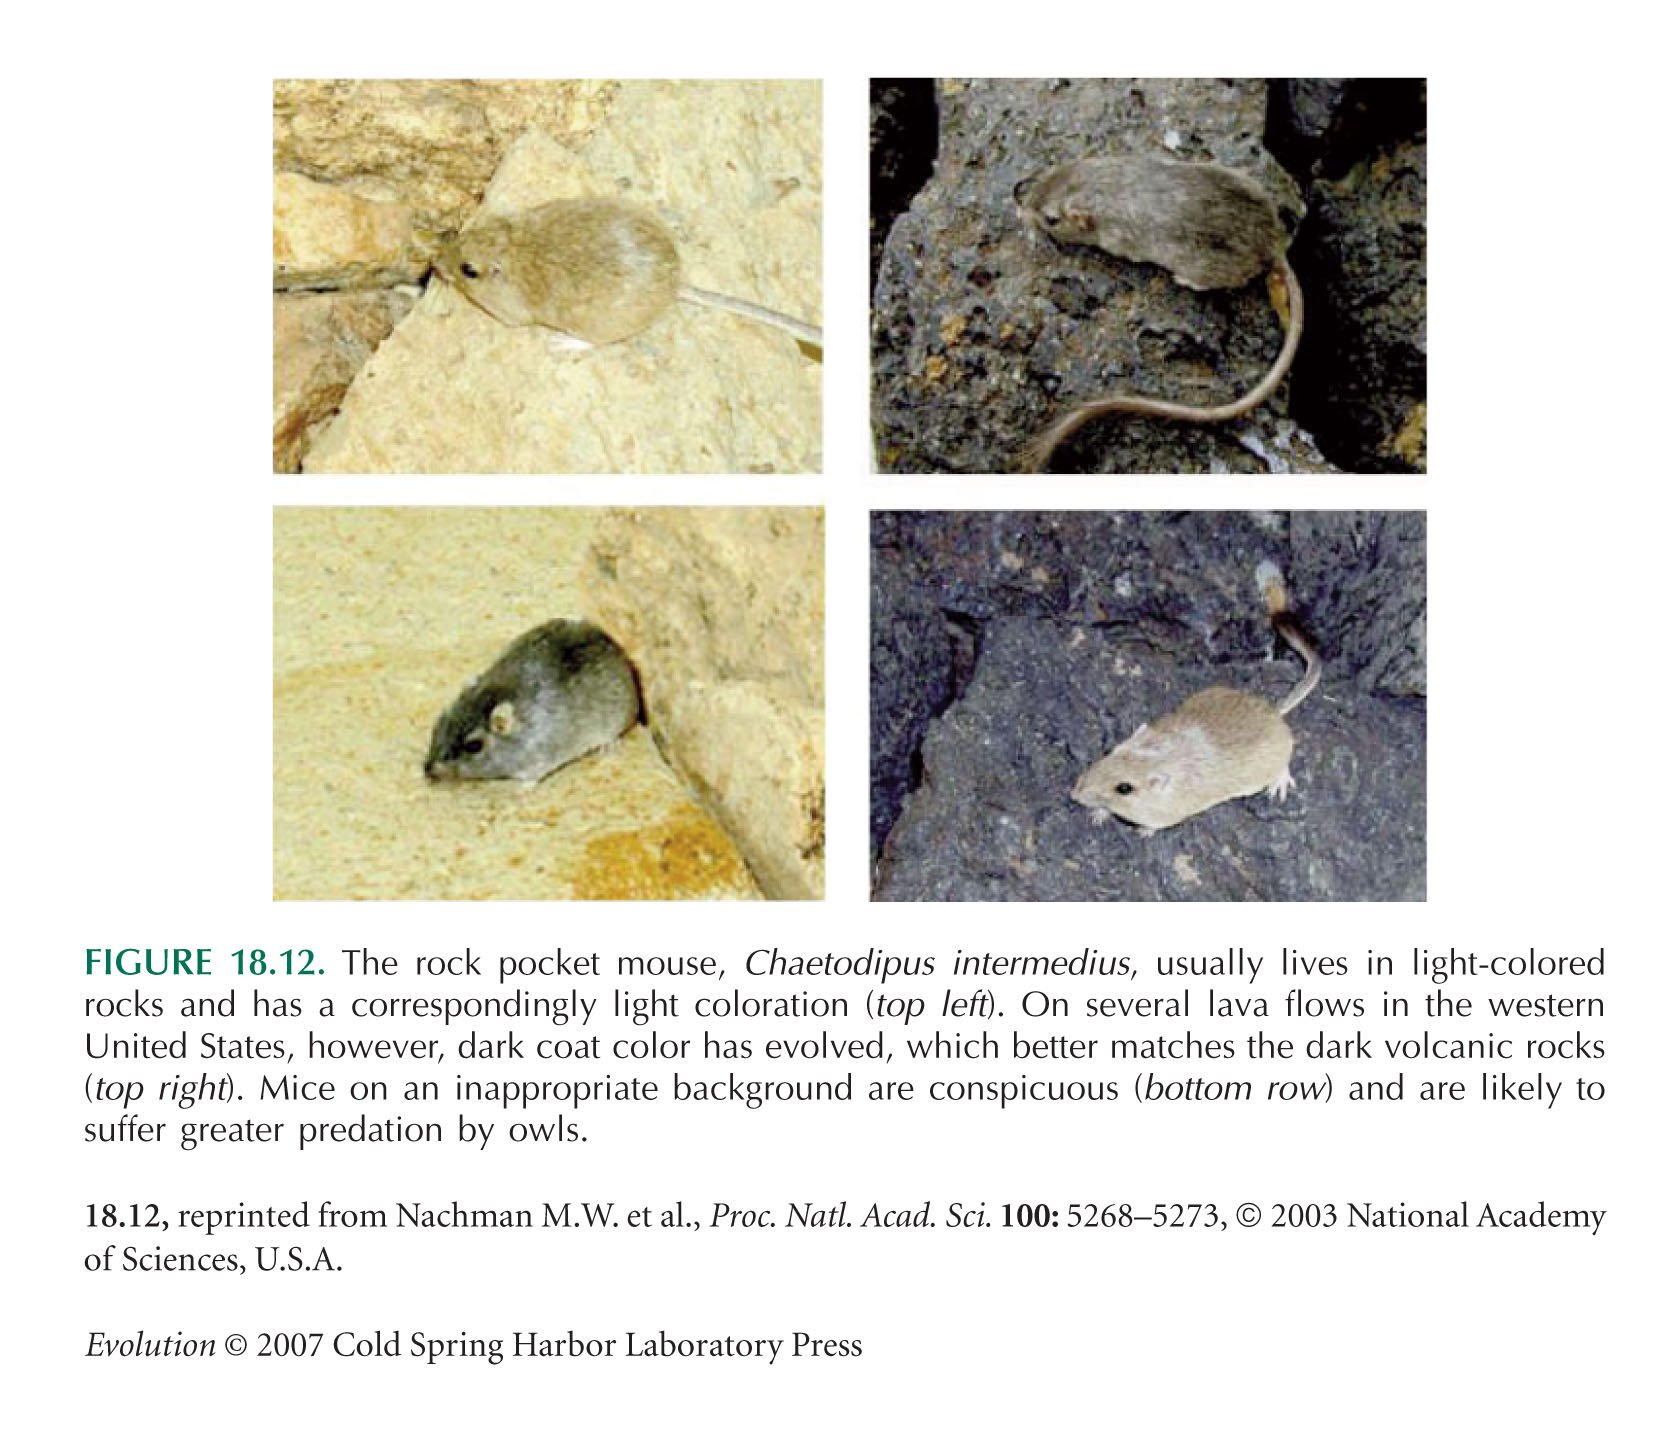
An interesting application of association studies to a natural population comes from the rock pocket mice (Chaetodipus intermedius), which have evolved melanic forms on dark lava flows (Fig. 18.12). Nachman (2005) and Nachman et al. (2003) show that in one population, melanism is due to four mutations in the melanocortin-1 receptor (Mc1r). However, this gene is not responsible for melanism in other populations of this species.
Genetic Manipulation Can Confirm the Genetic Basis of Trait Variation
Figure 14.27 is based on the work of Stam and Laurie (1996).
Note that for both bristle number and Adh activity in Drosophila, large insertions as a class do have a causal effect. However, the evidence for this comes from their common biological features (i.e., they are transposable elements) rather than from a purely statistical argument.
Fisher’s Geometrical Argument Emphasizes Alleles of Small Effect
Paley (1802) introduced the analogy between living organisms and optical instruments to support the argument from design (pp. 11, 16, and 78). Darwin also used the analogy in On the Origin of Species, in the section discussing “organs of extreme perfection.” The argument that small changes to a complex structure are most likely to be favorable permeates Darwin’s writings; it was made explicit by Fisher (1930), who also began by making an analogy with a finely adjusted microscope. Orr and Coyne (1992) discuss the influence of Fisher’s argument and the limited empirical evidence that the alleles responsible for adaptation are in fact of small effect. (See Chapter 3 Web Notes.)
Kimura (1983, Chapter 6.6) pointed out that because the probability of fixation of a favorable allele is proportional to its selective advantage (p. 490), adaptation is most likely to be due to mutations of intermediate effect. Orr (1998, 2000) analyzes this argument in more detail and extends it to the whole “adaptive walk” that takes a population toward the optimum via a series of substitutions.
The genetic basis of insecticide resistance is reviewed by ffrench-Constant et al. (2000) and by Li et al. (2007). Weatherall (2001) discusses the wide variety of mutations to β-globin that are involved in human resistance to malaria.
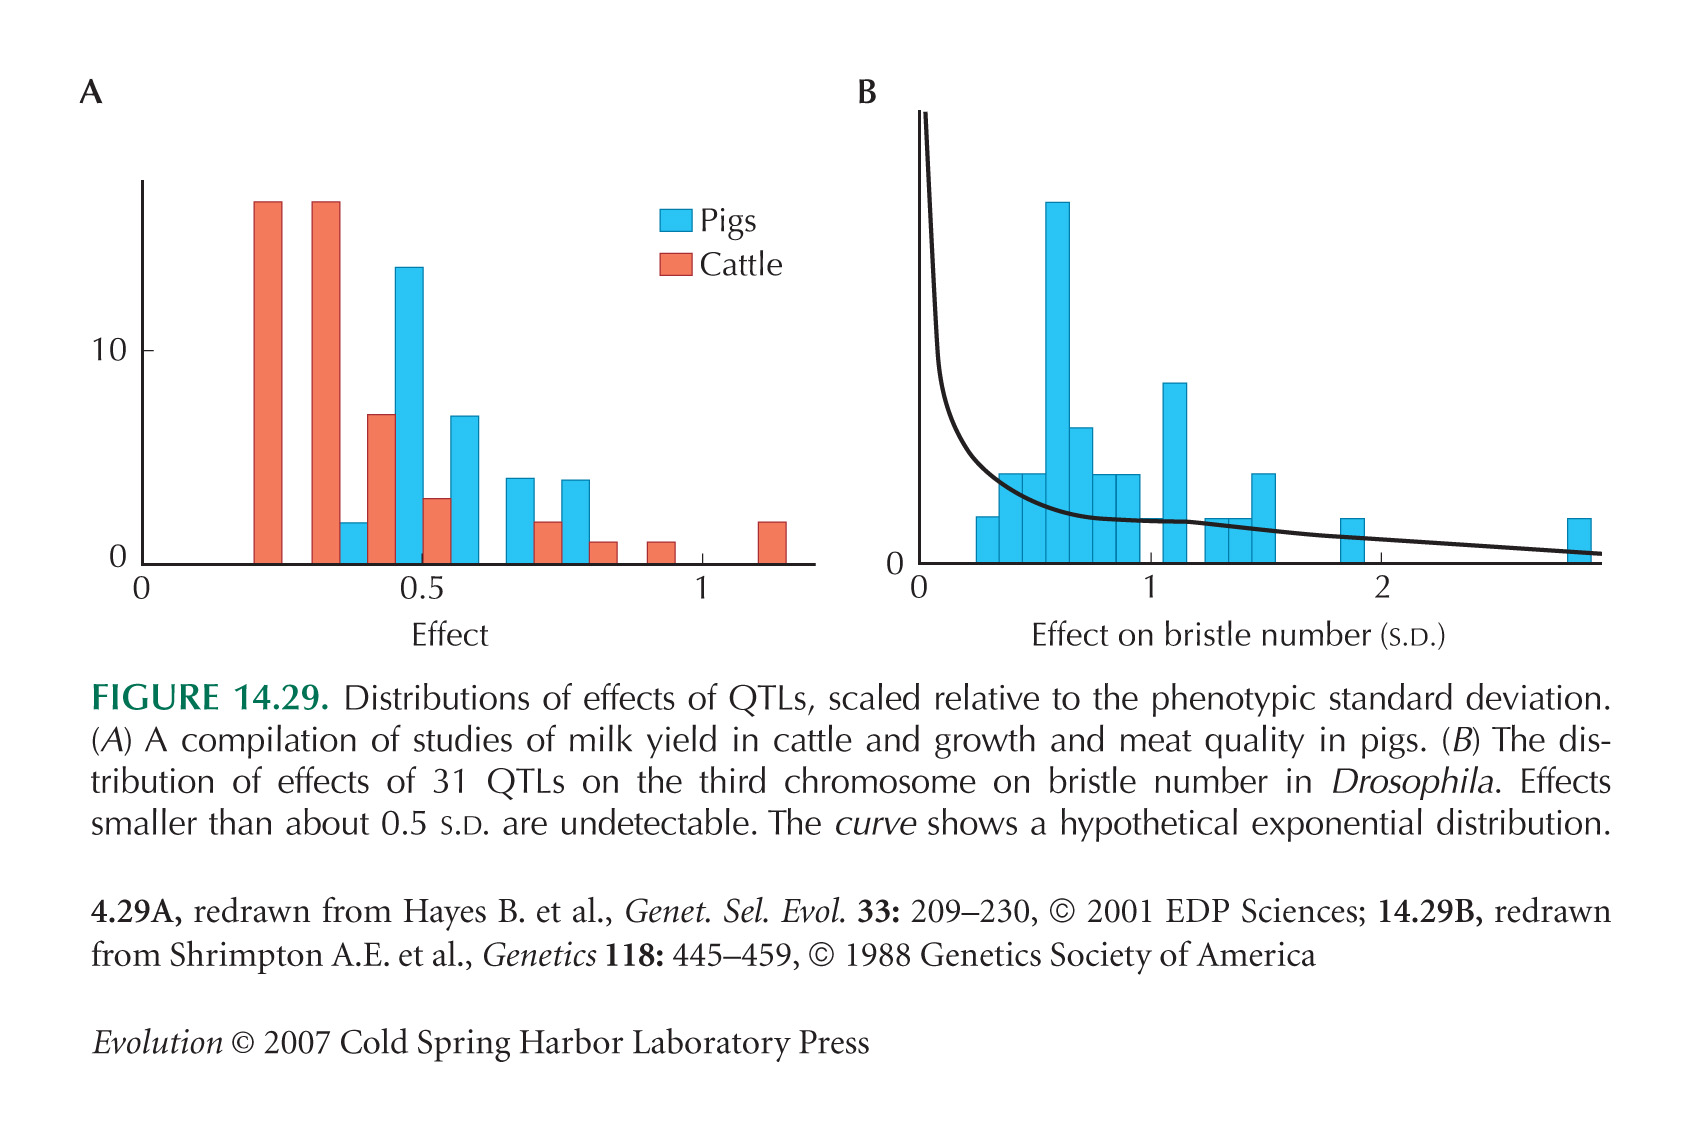
Quantitative Variation Is Based on Alleles with a Range of Effects and Interactions
The distributions of QTL effects in Figure 14.29 are from Hayes and Goddard (2001) and Shrimpton and Robertson (1988a,b), respectively. Morjan and Rieseberg (2004) give a more recent review of QTLs effects, emphasizing evolutionary aspects, and Flint et al. (2005) review rodent QTLs.
Generation of Quantitative Variation
Mutation Generates Abundant Heritable Variation
Hill (1982) was influential in pointing out that mutation may make a substantial contribution to selection response after some tens of generations. Lynch and Walsh (1998, Chapter 12) and Lynch et al. (1999) review evidence on rates of mutation affecting quantitative traits. Caballero et al. (1995) criticize the two exceptionally high estimates of mutation rate in mice, given in Table 14.3 (this is Table 12.1 of Lynch and Walsh 1998).
If individual mutations had infinitesimally small effects, selection would have a negligible effect on their frequency, and so genetic variance would accumulate steadily, at a rate VM per generation. This infinitesimal model gives a baseline prediction, which is discussed on page 483. However, mutations with large effects on the trait can be picked up by selection and so contribute to a faster response to selection than predicted from measurements of VM, which are made in the absence of selection. Conversely, mutations with an appreciable deleterious effect will be eliminated.
For simplicity, it can be assumed that mutations have additive effects and that there is no directional bias (i.e., E[αi] = 0) (including dominance and epistasis makes little qualitative difference).
A comparison between different kinds of traits supports the idea that the mutational variance depends on the number of genes involved. See .
Figure 14.30 is taken from Azevedo et al. (2002).
High Mutational Variance Could Be Due to Mutations of Large Effects or a High Mutation Rate
Kimura (1965) and Lande (1975) argued that quantitative genetic variation could be maintained by a balance between mutation and selection if mutation generates alleles with small effects on the trait. Turelli (1984) argued that in fact mutation produces alleles with large effects, relative to the standing variation at a QTL. We discuss this issue on pages 513–514; for the moment, note that Turelli (1984) provides what is still an excellent review of the effect of mutation on quantitative traits. Barton and Keightley (2002) give an update on this argument.
Mackay (1984) first used transposable element insertions to measure the distribution of mutational effects; for a review, see Mackay (2001b).
Although the effects of new mutations cannot be detected through their effects on single individuals, they can be detected by measuring large numbers of individuals from an inbred line that has fixed the mutation. Classic estimates from mouse and maize are reviewed by Turelli (1984), Lynch and Walsh (1998, Chapter 12), and Barton and Keightley (2002). However, these estimates of total mutation rate, Σµi, are much less robust than estimates of VM.
Frankham et al. (1978, 1980) show that unequal crossing-over at ribosomal DNA loci contributes to the response to selection on bristle number in Drosophila. Lynch and Walsh (1998, p. 328) discuss several other examples where rDNA contributes to quantitative variation.
In an exceptionally careful study, Weber et al. (2005) show that 11 out of 50 randomly inserted transposable elements cause subtle effects on wing shape—and none of these are near to candidate genes. This suggests that a very large number of genes may have slight effects on a quantitative trait.
References
Allison A.C. 1964. Population genetics of abnormal haemoglobins. In Council for International Organisations for Medical Science Symposium on abnormal haemoglobins. Blackwell, Oxford.
Allison A.C. 1956. The sickle-cell and haemoglobin C genes in some African populations. Ann. Hum. Genet. 21: 67.
Azevedo R.B.R., Keightley P.D., Lauren-Maatta C., Vassilieva L., Lynch M., et al. 2002. Spontaneous mutational variation for body size in Caenorhabditis elegans. Genetics 162: 755–765.
Barton N.H. and Keightley P.D. 2002. Understanding quantitative genetic variation. Nat. Rev. Genet. 3: 11–21.
Beadle G.W. 1939. Teosinte and the origin of maize. J. Hered. 30: 245–247.
Beavis W.D. 1994. The power and deceit of QTL experiments: Lessons from comparative QTL studies. In Proceedings of the Corn and Sorghum Industry Research Conference, pp. 250–266. American Seed Trade Association, Washington, D.C.
Berthold P. 2001. Bird migration: A general survey. Oxford University Press, New York.
Caballero A., Keightley P.D., and Hill W.G. 1995. Accumulation of mutations affecting body weight in inbred mouse lines. Genet. Res. 65: 145–150.
Clark A.G. and Wang L. 1997. Epistasis in measured genotypes: Drosophila P-element insertions. Genetics 147: 157–164.
Crnokrak P. and Roff D.A. 1995. Dominance variance—Associations with selection and fitness. Heredity 75: 530–540.
Doebley J. 2001. George Beadle’s other hypothesis: One-gene, one-trait. Genetics 158: 487–493.
Doebley J. and Stec A. 1991. Genetic analysis of the morphological differences between maize and teosinte. Genetics 129: 285–295.
Doebley J. and Stec A. 1993. Inheritance of the morphological differences between maize and teosinte: Comparison of results for two F2 populations. Genetics 134: 559–570.
Doebley J., Stec A., and Gustus C. 1995. teosinte branched1 and the origin of maize: Evidence for epistasis and the evolution of dominance. Genetics 141: 333–346.
Falconer D.S. 1985. A note on Fisher’s “average effect” and “average excess.” Genet. Res. 46: 337–348.
Falconer D.S. and Mackay T.F.C. 1995. Introduction to quantitative genetics. Longman, London.
ffrench-Constant R.H., Anthony N., Aronstein K., Rocheleau T., and Stilwell G. 2000. Cyclodiene insecticide resistance: From molecular to population genetics. Annu. Rev. Entomol. 45: 449–466.
Fisher R.A. 1930. The genetical theory of natural selection. Oxford University Press, Oxford.
Flint J., Valdar W., Shifman S., and Mott R. 2005. Strategies for mapping and cloning quantitative trait genes in rodents. Nat. Rev.Genet. 298: 2345–2349.
Frankham R., Briscoe D.A., and Nurthen R.K. 1978. Unequal crossing over at the rRNA locus as a source of quantitative genetic variation. Nature 272: 80–81.
Frankham R., Briscoe D.A., and Nurthen R.K. 1980. Unequal crossing over at the rDNA tandon as a source of quantitative genetic variation in Drosophila. Genetics 95: 727–742.
Frary A. and Nesbitt T.C. 2000. fw2.2: A quantitative trait locus key to the evolution of tomato fruit size. Science 289: 85–88.
Frary A., Nesbitt T.C., Grandillo S., Knaap E., Cong B., Liu J., Meller J., Elber R., Alpert K.B., and Tanksley S.D. 2000. fw2.2: A quantitative trait locus key to the evolution of tomato fruit size. Science 289: 85–88.
Gibson G. and Wagner G. 2000. Canalization in evolutionary genetics: A stabilizing theory? Bioessays 22: 372–380.
Glazier A.M., Nadeau J.H., and Aitman T.J. 2002. Finding genes that underlie complex traits. Science 298: 2345–2349.
Hayes B. and Goddard M.E. 2001. The distribution of the effects of genes affecting quantitative traits in livestock. Genet. Sel. Evol. 33: 209–230.
Hill W.G. 1982. Rates of change in quantitative traits from fixation of new mutations. Proc. Natl. Acad. Sci. 79: 142–145.
Houle D. 1992. Comparing evolvability and variability of quantitative traits. Genetics 130: 195–204.
Houle D., Moriwaka B., and Lynch M. 1996. Comparing mutational variabilities. Genetics 143: 1467–1483.
Kimura M. 1965. A stochastic model concerning the maintenance of genetic variability in quantitative characters. Proc. Natl. Acad. Sci. 54: 731–736.
Kimura M. 1983. The neutral theory of molecular evolution. Cambridge University Press, Cambridge.
Kitano H. 2002a. Computational systems biology. Nature 420: 206–210.
Kitano H. 2002b. Systems biology: A brief overview. Science 295: 1662–1664.
Korstanje R. and Paigen B. 2002. From QTL to gene: The harvest begins. Nat. Genet. 31: 235–336.
Lande R. 1981. The minimum number of genes contributing to quantitative variation between and within populations. Genetics 99: 541–553.
Lande R. 1975. The maintenance of genetic variability by mutation in a polygenic character with linked loci. Genet. Res. 26: 221–236.
Li X.L., Schuler M.A., and Berenbaum M.R. 2007. Molecular mechanisms of metabolic resistance to synthetic and natural xenobiotics. Annu. Rev. Entomol. 52: 231–253.
Long A.D., Lyman R.F., Langley C.H., and Mackay T.F.C. 1998. Two sites in the Delta gene region contribute to naturally occurring variation in bristle number in Drosophila melanogaster. Genetics 149: 999–1017.
Long A.D., Mullaney S.L., Mackay T.F.C., and Langley C.H. 1997. Genetic interactions between naturally occurring alleles at quantitative trait loci and mutant alleles at candidate loci affecting bristle number in Drosophila melanogaster. Genetics 144: 1497–1510.
Long A.D., Mullaney S.P., Reid L.A., Fry J.D., Langley C.H., et al. 1995. High resolution genetic mapping of genetic factors affecting abdominal bristle number in Drosophila melanogaster. Genetics 139: 1273–1291.
Lynch M. and Walsh J.B. 1998. Genetics and analysis of quantitative traits. Sinauer Press, Sunderland, Massachussetts.
Lynch M., Blanchard J., Houle D., Kibota T., Schultz S., Vassilieva L., and Willis J. 1999. Spontaneous deleterious mutation. Evolution 53: 645–663.
Mackay T.F.C. 1984. Jumping genes meet abdominal bristles: Hybrid dysgenesis induced quantitative variation in Drosophila melanogaster. Genet. Res. 44: 231–238.
Mackay T.F.C. 2001a. The genetic architecture of quantitative traits. Annu. Rev. Genet. 35: 303–339.
Mackay T.F.C. 2001b. Quantitative trait loci in Drosophila. Nat. Rev. Genet. 2: 11–20.
Mackay T.F.C. and Langley C.H. 1990. Molecular and phenotypic variation in the achaete-scute region of Drosophila melanogaster. Nature 348: 64–66.
Maynard Smith J. and Sondhi K. 1960. The genetics of a pattern. Genetics 45: 1039–1050.
McClearn G.E., Johansson B., Berg S., Pedersen N.L., Ahern F., et al. 1997. Substantial genetic influence on cognitive abilities in twins 80 or more years old. Science 276: 1560–1563.
Morjan C.L. and Rieseberg L.H. 2004. How species evolve collectively: Implications of gene flow and selection for the spread of advantageous alleles. Mol. Ecol. 13: 1341–1356.
Mousseau T.A. and Roff D.A. 1987. Natural selection and the heritability of fitness components. Heredity 59: 181–198.
Nachman M.W. 2005. The genetic basis of adaptation: Lessons from concealing coloration in pocket mice. Genetica 123: 125–136.
Nachman M.W., Hoekstra H.E., and D’Agostino S.L. 2003. The genetic basis of adaptive melanism in pocket mice. Proc. Natl. Acad. Sci. 100: 5268–5273.
Nürnberger B.D., Barton N.H., MacCallum C., Gilchrist J., and Appleby M. 1995. Natural selection on quantitative traits in the Bombina hybrid zone. Evolution 49: 1224–1238.
Olsen H.G., Lien S., Gautier M., Nilsen H., Roseth A., et al. 2005. Mapping of a milk production quantitative trait locus to a 420-kb region on bovine chromosome 6. Genetics 169: 275–283.
Orr H.A. 1998. The population genetics of adaptation: The distribution of factors fixed during adaptive evolution. Evolution 52: 935–949.
Orr H.A. 2000. Adaptation and the cost of complexity. Evolution 54: 13–20.
Orr H.A. and Coyne J.A. 1992. The genetics of adaptation: A reassessment. Am. Nat. 140: 725–742.
Paley W. 1802. Natural theology: Or, evidences of the existence and attributes of the deity, collected from the appearances of Nature. R. Fauldner, London.
Payne F. 1918. The effect of artificial selection on bristle number on Drosophila ampelophila and its interpretation. Proc. Natl. Acad. Sci. 4: 55–58.
Pearson K. and Lee A. 1903. On the laws of inheritance in man. I. Inheritance of physical characters. Biometrika 2: 357–462.
Pigliucci M. 2001. Phenotypic plasticity: Beyond nature and nurture. Johns Hopkins University Press, Baltimore, Maryland.
Powers L. 1950. Determining scales and the use of transformations in studies of weight per locule of tomato fruit. Biometrics 6: 145–163.
Quackenbush J. 2001. Computational analysis of microarray data. Nat. Rev. Genet. 2: 418–427.
Ridley M. 2003. Nature via nurture: The origin of the individual. Fourth Estate, London.
Roff D.A. 1997. Evolutionary quantitative genetics. Chapman and Hall, New York.
Rutherford S.L. 2000. From genotype to phenotype: Buffering mechanisms and the storage of genetic information. BioEssays 22: 1095–1105.
Sax K. 1923. The association of size differences with seed-coat pattern and pigmentation in Phaseolus vulgaris. Genetics 8: 552–560.
Scharloo W. 1991. Canalization: Genetic and developmental aspects. Ann. Rev. Ecol. Syst. 22: 65–94.
Shrimpton A.E. and Robertson A. 1988a. The isolation of polygenic factors controlling bristle score in Drosophila melanogaster. I. Allocation of third chromosome sternopleural bristle effect to chromosome sections. Genetics 118: 437–443.
Shrimpton A.E. and Robertson A. 1988b. The isolation of polygenic factors controlling bristle score in Drosophila melanogaster. II. Distribution of third chromosome bristle effects within chromosome sections. Genetics 118: 445–459.
Stam L.F. and Laurie C.C. 1996. Molecular dissection of a major gene effect on a quantitative trait: The level of alcohol dehydrogenase expression in Drosophila melanogaster. Genetics 144: 1559–1564.
Turelli M. 1984. Heritable genetic variation via mutation-selection balance: Lerch’s zeta meets the abdominal bristle. Theor. Popul. Biol. 25: 138–193.
Via S. and Hawthorne D.J. 2002. The genetic architecture of ecological specialization: Correlated gene effects on host use and habitat choice in pea aphids. Am. Nat. 159(S): 76–88.
Vogel F. and Motulsky A.G. 1997. Human genetics: Problems and approaches. Springer-Verlag, Berlin.
Waddington C.H. 1942. Canalization of development and the inheritance of acquired characters. Nature 150: 563–565.
Waddington C.H. 1957. The strategy of the genes. Allen and Unwin, London.
Weatherall D.J. 1991. The new genetics and clinical practice, 3rd ed. Oxford University Press, Oxford.
Weatherall D.J. 2001. Phenotype-genotype relationships in monogenic disease: Lessons from the thalassemias. Nat. Rev. Genet. 2: 245–255.
Weber K.E. 1990. Selection on wing allometry in Drosophila melanogaster. Genetics 126: 975–989.
Weber K., Johnson N.A., Champlin D., and Patty A. 2005. Many P-element insertions affect wing shape in Drosophila melanogaster. Genetics 169: 1461–1475.
Weber K., Eisman R., Higgins S., Morey L., Patty A., et al. 2001. An analysis of polygenes affecting wing shape on chromosome 2 in Drosophila melanogaster. Genetics 159: 1045–1057.
Weber K.E., Eisman R., Morey L., Patty A., Sparks J., Tausek M., and Zeng Z.B. 1999. An analysis of polygenes affecting wing shape on chromosome 3 in Drosophila melanogaster. Genetics 153: 773–786.
Zeng Z.B., Houle D., and Cockerham C.C. 1990. How informative is Wright’s estimator of the number of genes affecting a quantitative character? Genetics 126: 235–247.
|


