Chapter 15 Notes
Random Genetic Drift
Random Drift of Allele Frequencies
Allele Frequencies Change Whenever Individuals Have Different Numbers of Offspring
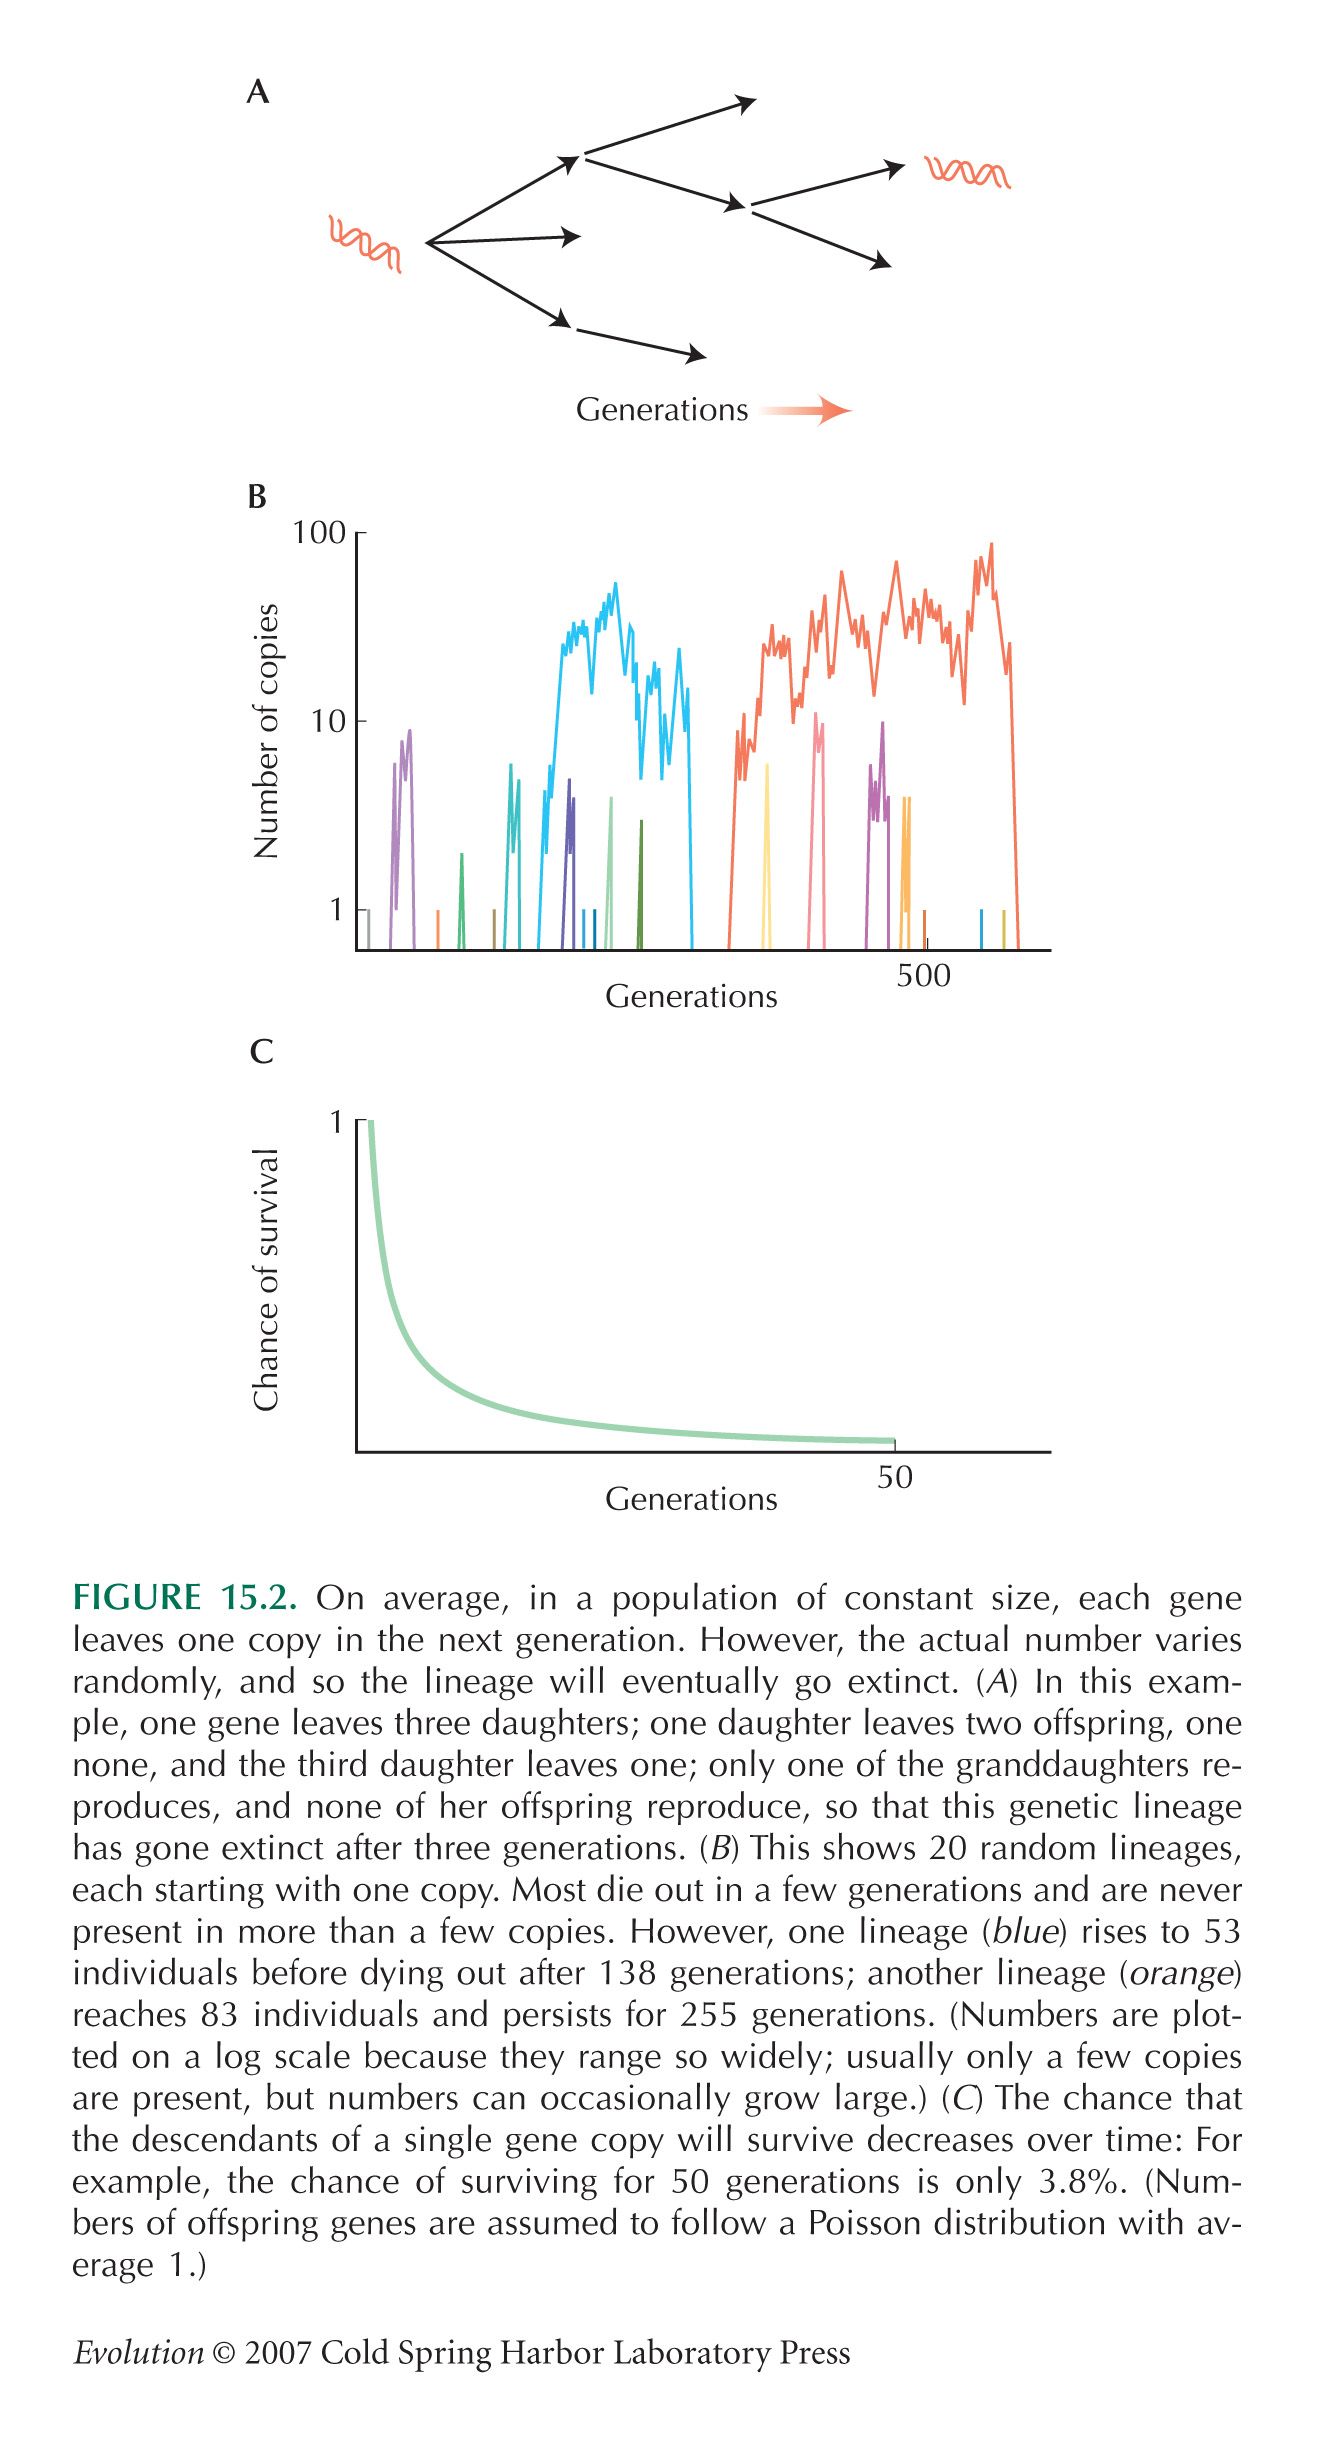
The mathematics of random reproduction, as illustrated in Figure 15.2, are explored further in Chapter 28.
Luria and Delbrück (1943) performed a classic experiment, the fluctuation test, showing that mutations that gave bacteriophage resistance occur randomly, before phage are present, rather than as an adaptive response to the selective challenge (pp. 345–346). Their experiment depends on the randomness of reproduction; we provide further details in .
The Wright–Fisher Model Is a Standard Representation of Random Drift
Crow and Kimura (1970) is still the best reference on the Wright–Fisher model and on random genetic drift more generally. Felsenstein’s lecture notes are perhaps more accessible.
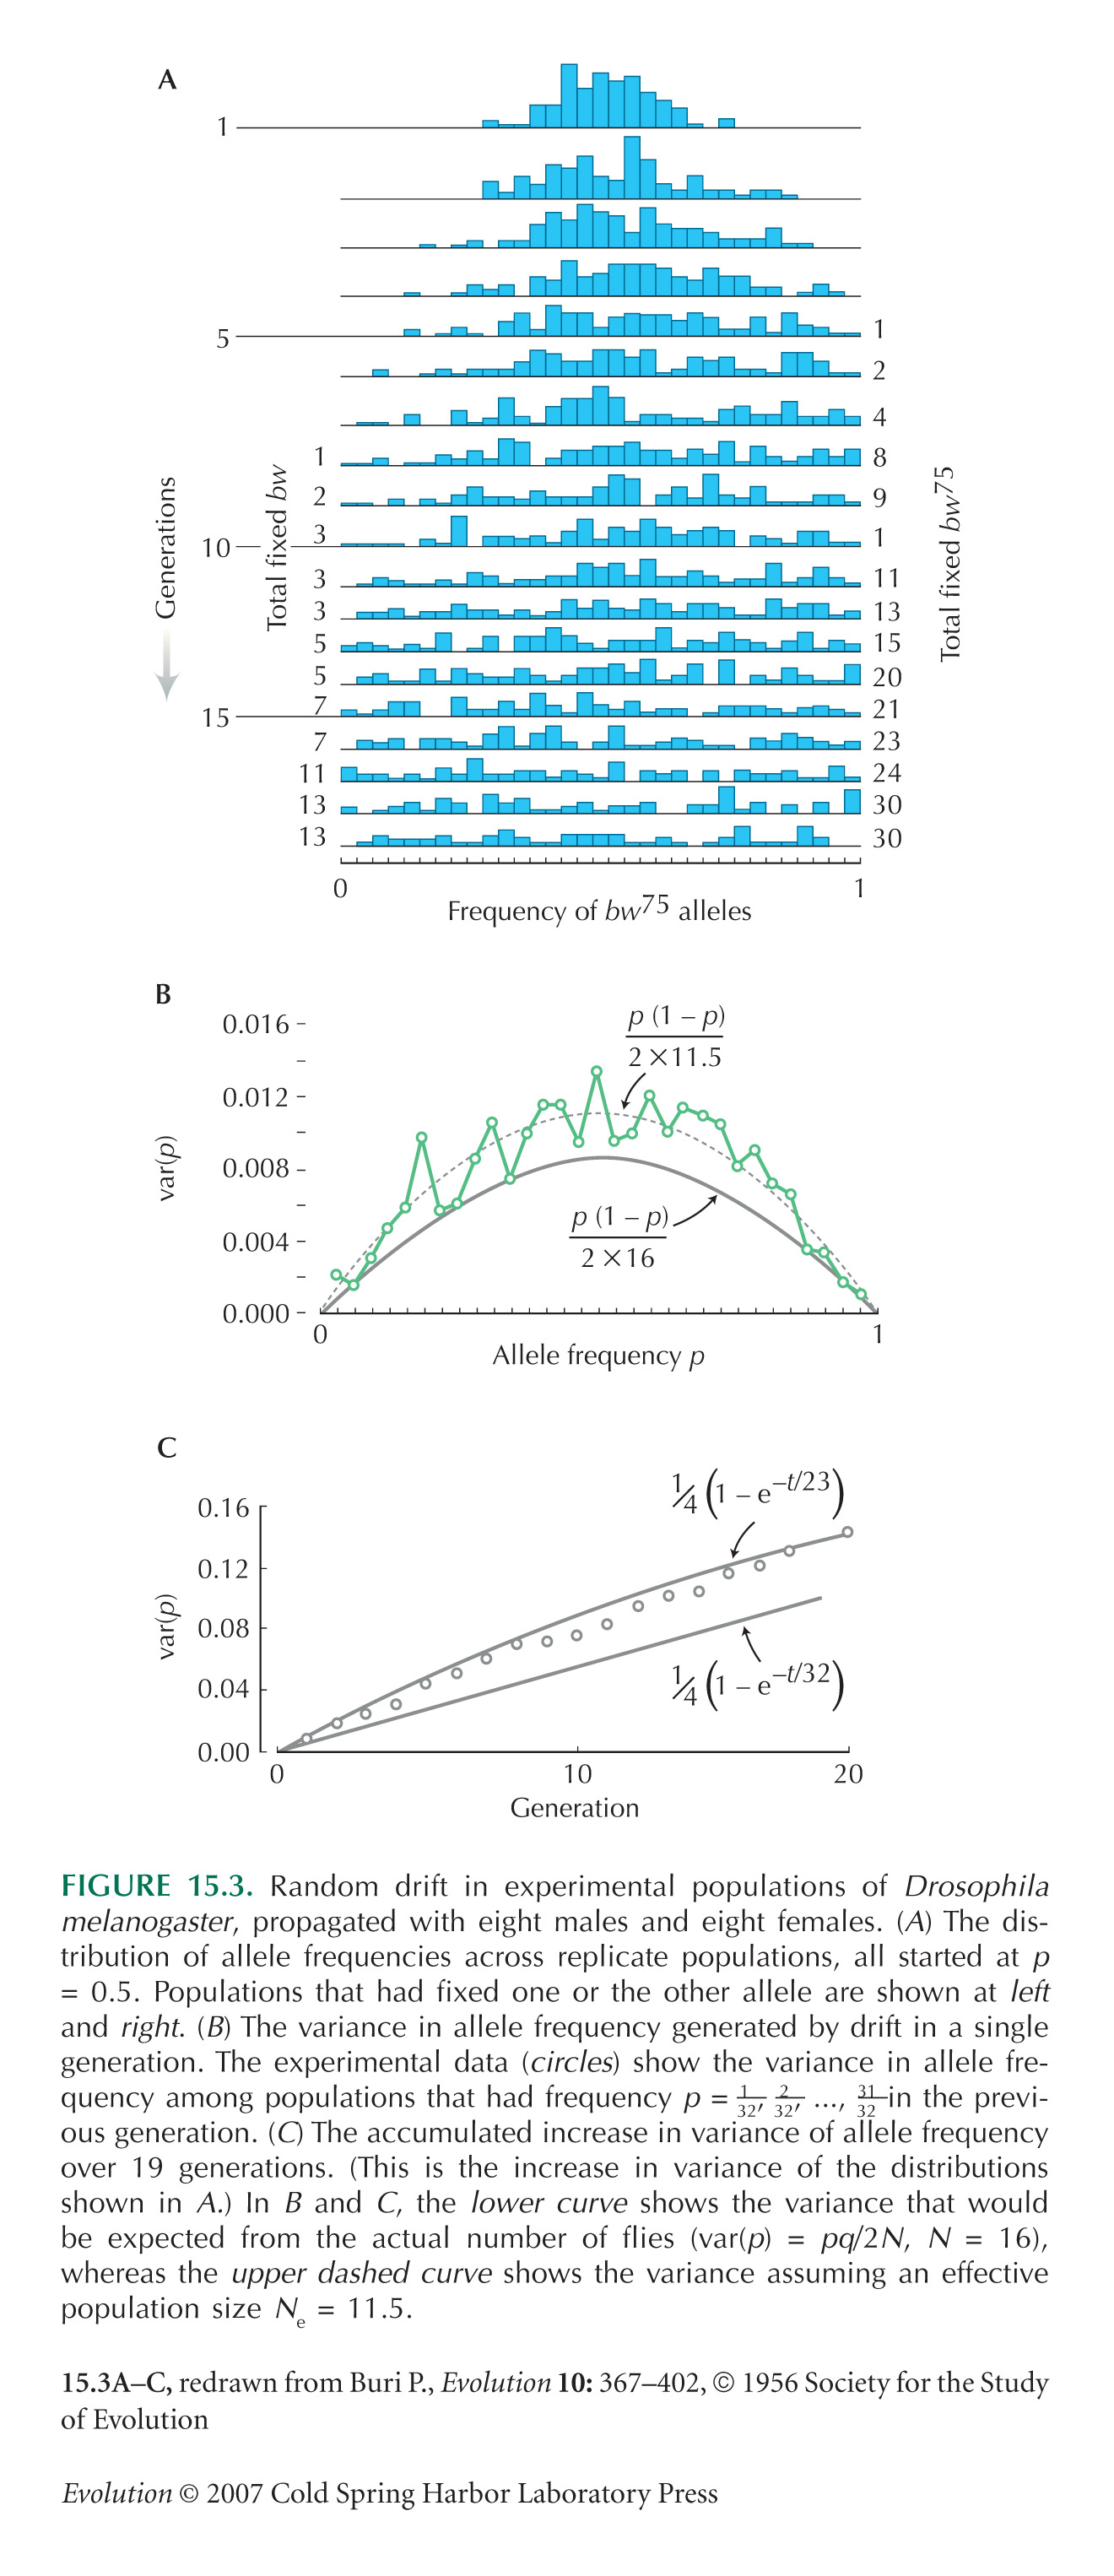
Figure 15.3 is taken from Buri (1956). Kerr and Wright (1954) performed similar experiments.
It is remarkable that the effect of drift on the mean of a quantitative trait is independent of its genetic basis. We explain why in .
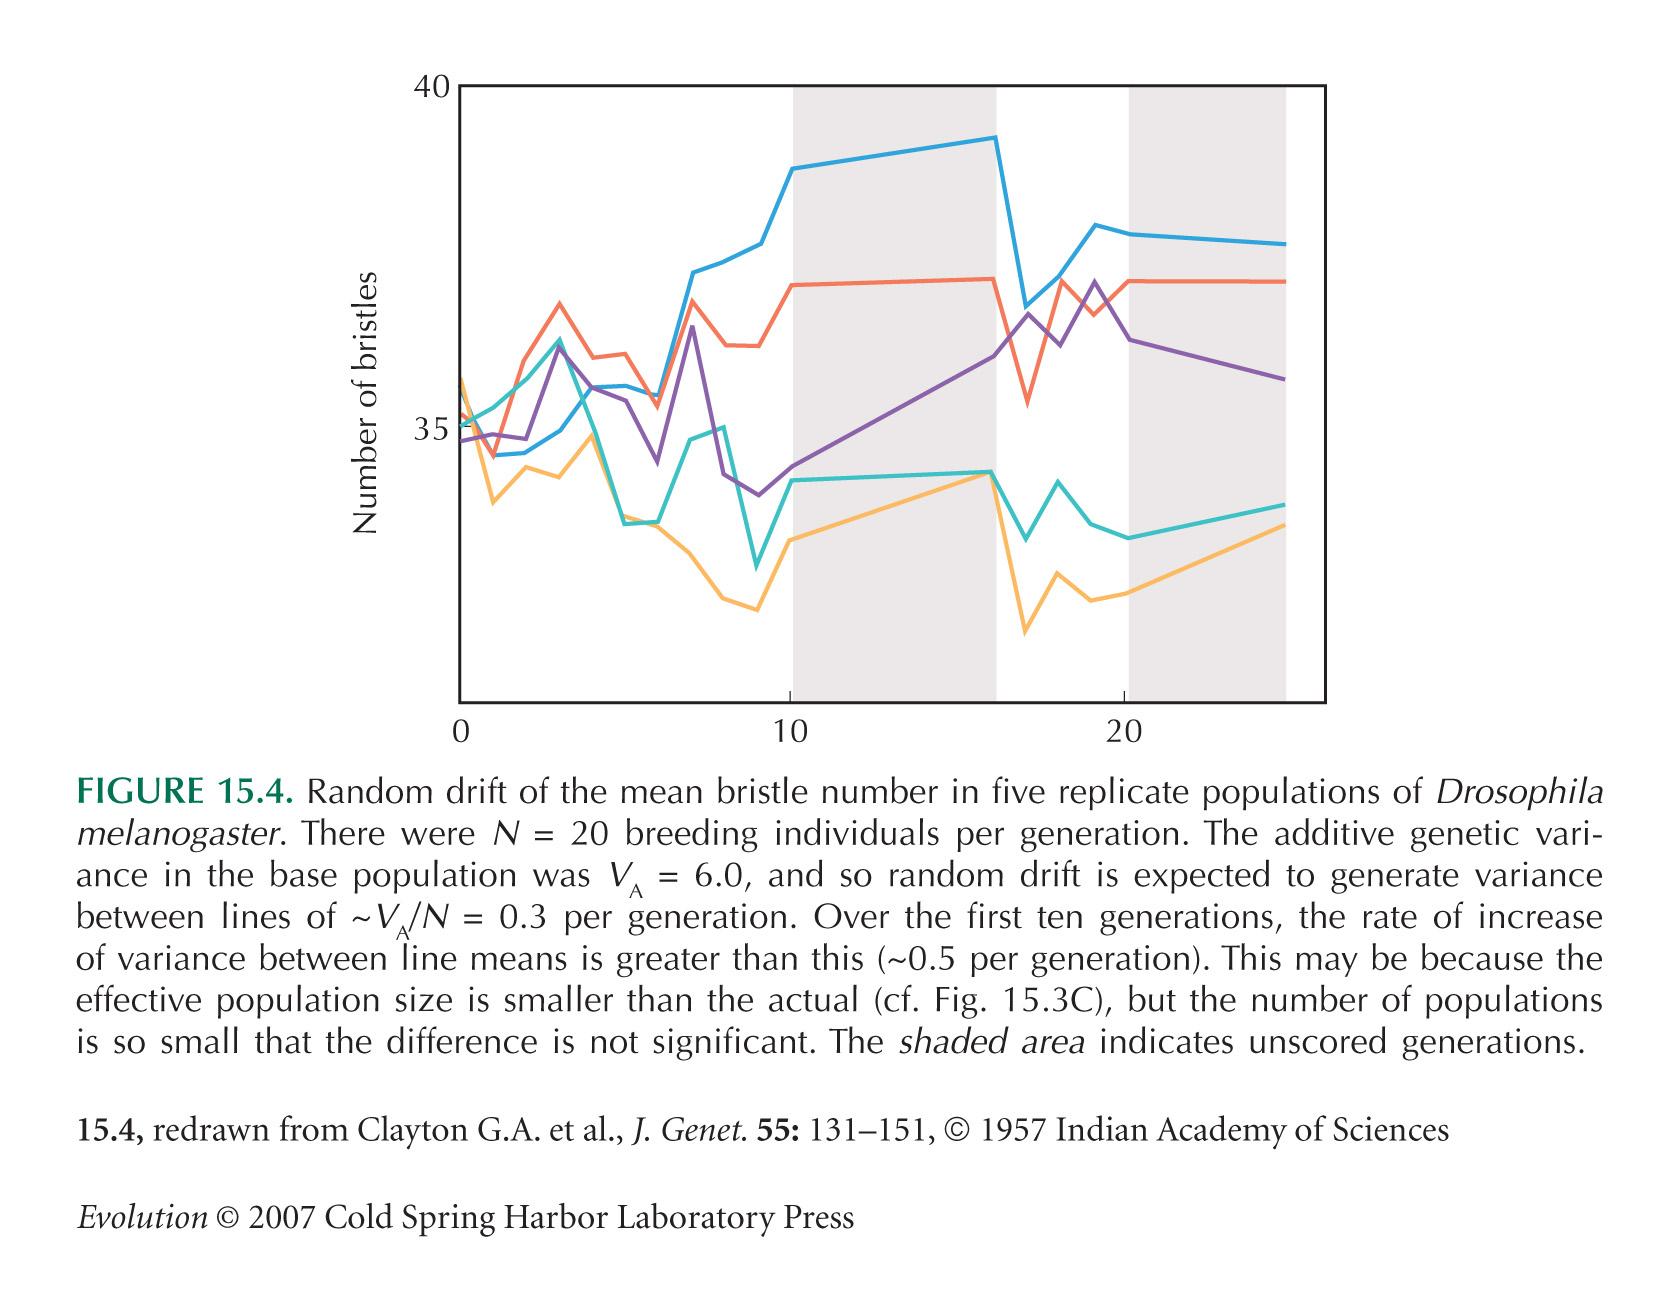
Figure 15.4 is from Clayton et al. (1957). Rich et al. (1984) give another example of drift in a quantitative trait.
The Rate of Random Drift Is Determined by the Variance in Fitness
For more on the factors that influence effective population size, see Crow and Kimura (1970, Chapter 3.13).
Short-term factors reduce effective population size below census numbers by a substantial factor. See Nunney (1994) and Vucetich et al. (1997).
Coalescence
Genetic Ancestry Is Described by a Process Known as Coalescence
Detailed accounts of the coalescent process can be found in Donnelly and Tavaré (1995), Rosenberg and Nordborg (2002), and Hein et al. (2005). Wakeley (2008) provides a comprehensive and accessible account.
The large-scale survey of human single-nucleotide polymorphism (SNP) variation was published with the draft human genome in Sachidanandam et al. (2001).
Felsenstein (1992) discusses the inherent randomness of the coalescent process and explains why this makes pairwise measures such as nucleotide diversity highly variable.
We will see later that the properties of the coalescent process are reflected in the patterns of variation generated by mutation. We explore some of these basic properties in .
Genealogies Can Be Inferred from Sequences
Because the rate of coalescence in the recent past is extremely high, the tips of a genealogy are often too short to have accumulated unique mutations. Thus, the more recent parts of a genealogy cannot be resolved.
The Neutral Theory
The Rate of Neutral Divergence Equals the Mutation Rate
The neutral theory of molecular evolution was proposed independently by Kimura (1968) and by King and Jukes (1968); it was subsequently developed primarily by Motoo Kimura. (The neutral theory was also proposed by Alan Robertson [1967] but dismissed in the same paragraph.)
If the genes have been diverging for a long time, then there is an appreciable chance that two mutations might occur at precisely the same site. Because only one mutational change would then be detected, the actual extent of divergence would be underestimated (Chapter 27). However, when we are studying variation in DNA sequence within a species, or between closely related species, this is not a serious problem. We can assume that mutations are spread over so many possible nucleotide sites that each is unique, that is, we assume the infinite-sites model (p. 424).
Note that the rate of 1.2 × 10⁻⁹ amino acid changes per year for α-globin, cited on p. 371, is consistent with the rate of one change per 6 Myr given here, because α-globin has 141 amino acids.
In The Absence of Selection, Neutral Variation Is Determined by a Balance between Mutation and Drift
Follow this for a derivation of genetic variability under the infinite-alleles model.
Abundant Species Have Less Genetic Diversity Than Expected from the Neutral Theory
Estimates of diversity (π = 0.01) and mutation rate (µ = 3 × 10⁻⁹ per site per generation) for Drosophila melanogaster are from Andolfatto and Przeworski (2000). Diversity estimates are based on 24 loci in regions of high recombination. The mutation rate is estimated from the divergence between the Drosophila obscura and D. melanogaster species groups, assuming ten generations per year and a split 30 Mya. (Estimates vary widely; for example, Sharp and Li [1989] use a value about half this, µ = 1.6 × 10⁻⁹.)
Selander and Levin (1980) published one of the first surveys of genetic diversity in bacteria. Maynard Smith (1990) reviews later work. Feil and Spratt (2001) and Gupta and Maiden (2001) review the structure of diversity in bacterial populations, focusing on the extent of recombination.
Maynard Smith and Haigh (1974) first proposed that hitchhiking is more important than conventional random genetic drift in reducing diversity. This idea has recently been developed by Gillespie (2000, 2001).
Recombination and Random Drift
Recombination Breaks Up the Genome into Regions with Different Ancestry
The idea of a “mitochondrial Eve” became popular after Cann et al. (1987) published their survey of human mtDNA. However, it was often used in a misleading way.
Strictly, these arguments apply only to the nonrecombining region of the Y chromosome. There is a small pseudoautosomal region that recombines with the X chromosome and so has a different ancestry (see pp. 682–683).
Chang (1999) showed that at about log2(N) generations in the past, an individual ancestral to the entire current population is likely to be found. NOTE WN15A Going back about twice as far, all individuals who are ancestors are likely to be ancestral to the entire present population. This assumes a pedigree version of the Wright–Fisher model, in which an individual’s two parents are drawn at random from the previous generation. Rohde et al. (2004) showed that human geographic structure does not alter these conclusions much.
Figure 15.12B,C is taken from Derrida et al. (1999).
Figure 15.13 is calculated using results in Barton and Etheridge (2003). The simulation assumes a very large and constant population.
The Pattern of Ancestry Depends on the Number of Recombination Events per Generation, Nec
Figure 15.15 is from Patil et al. (2001).
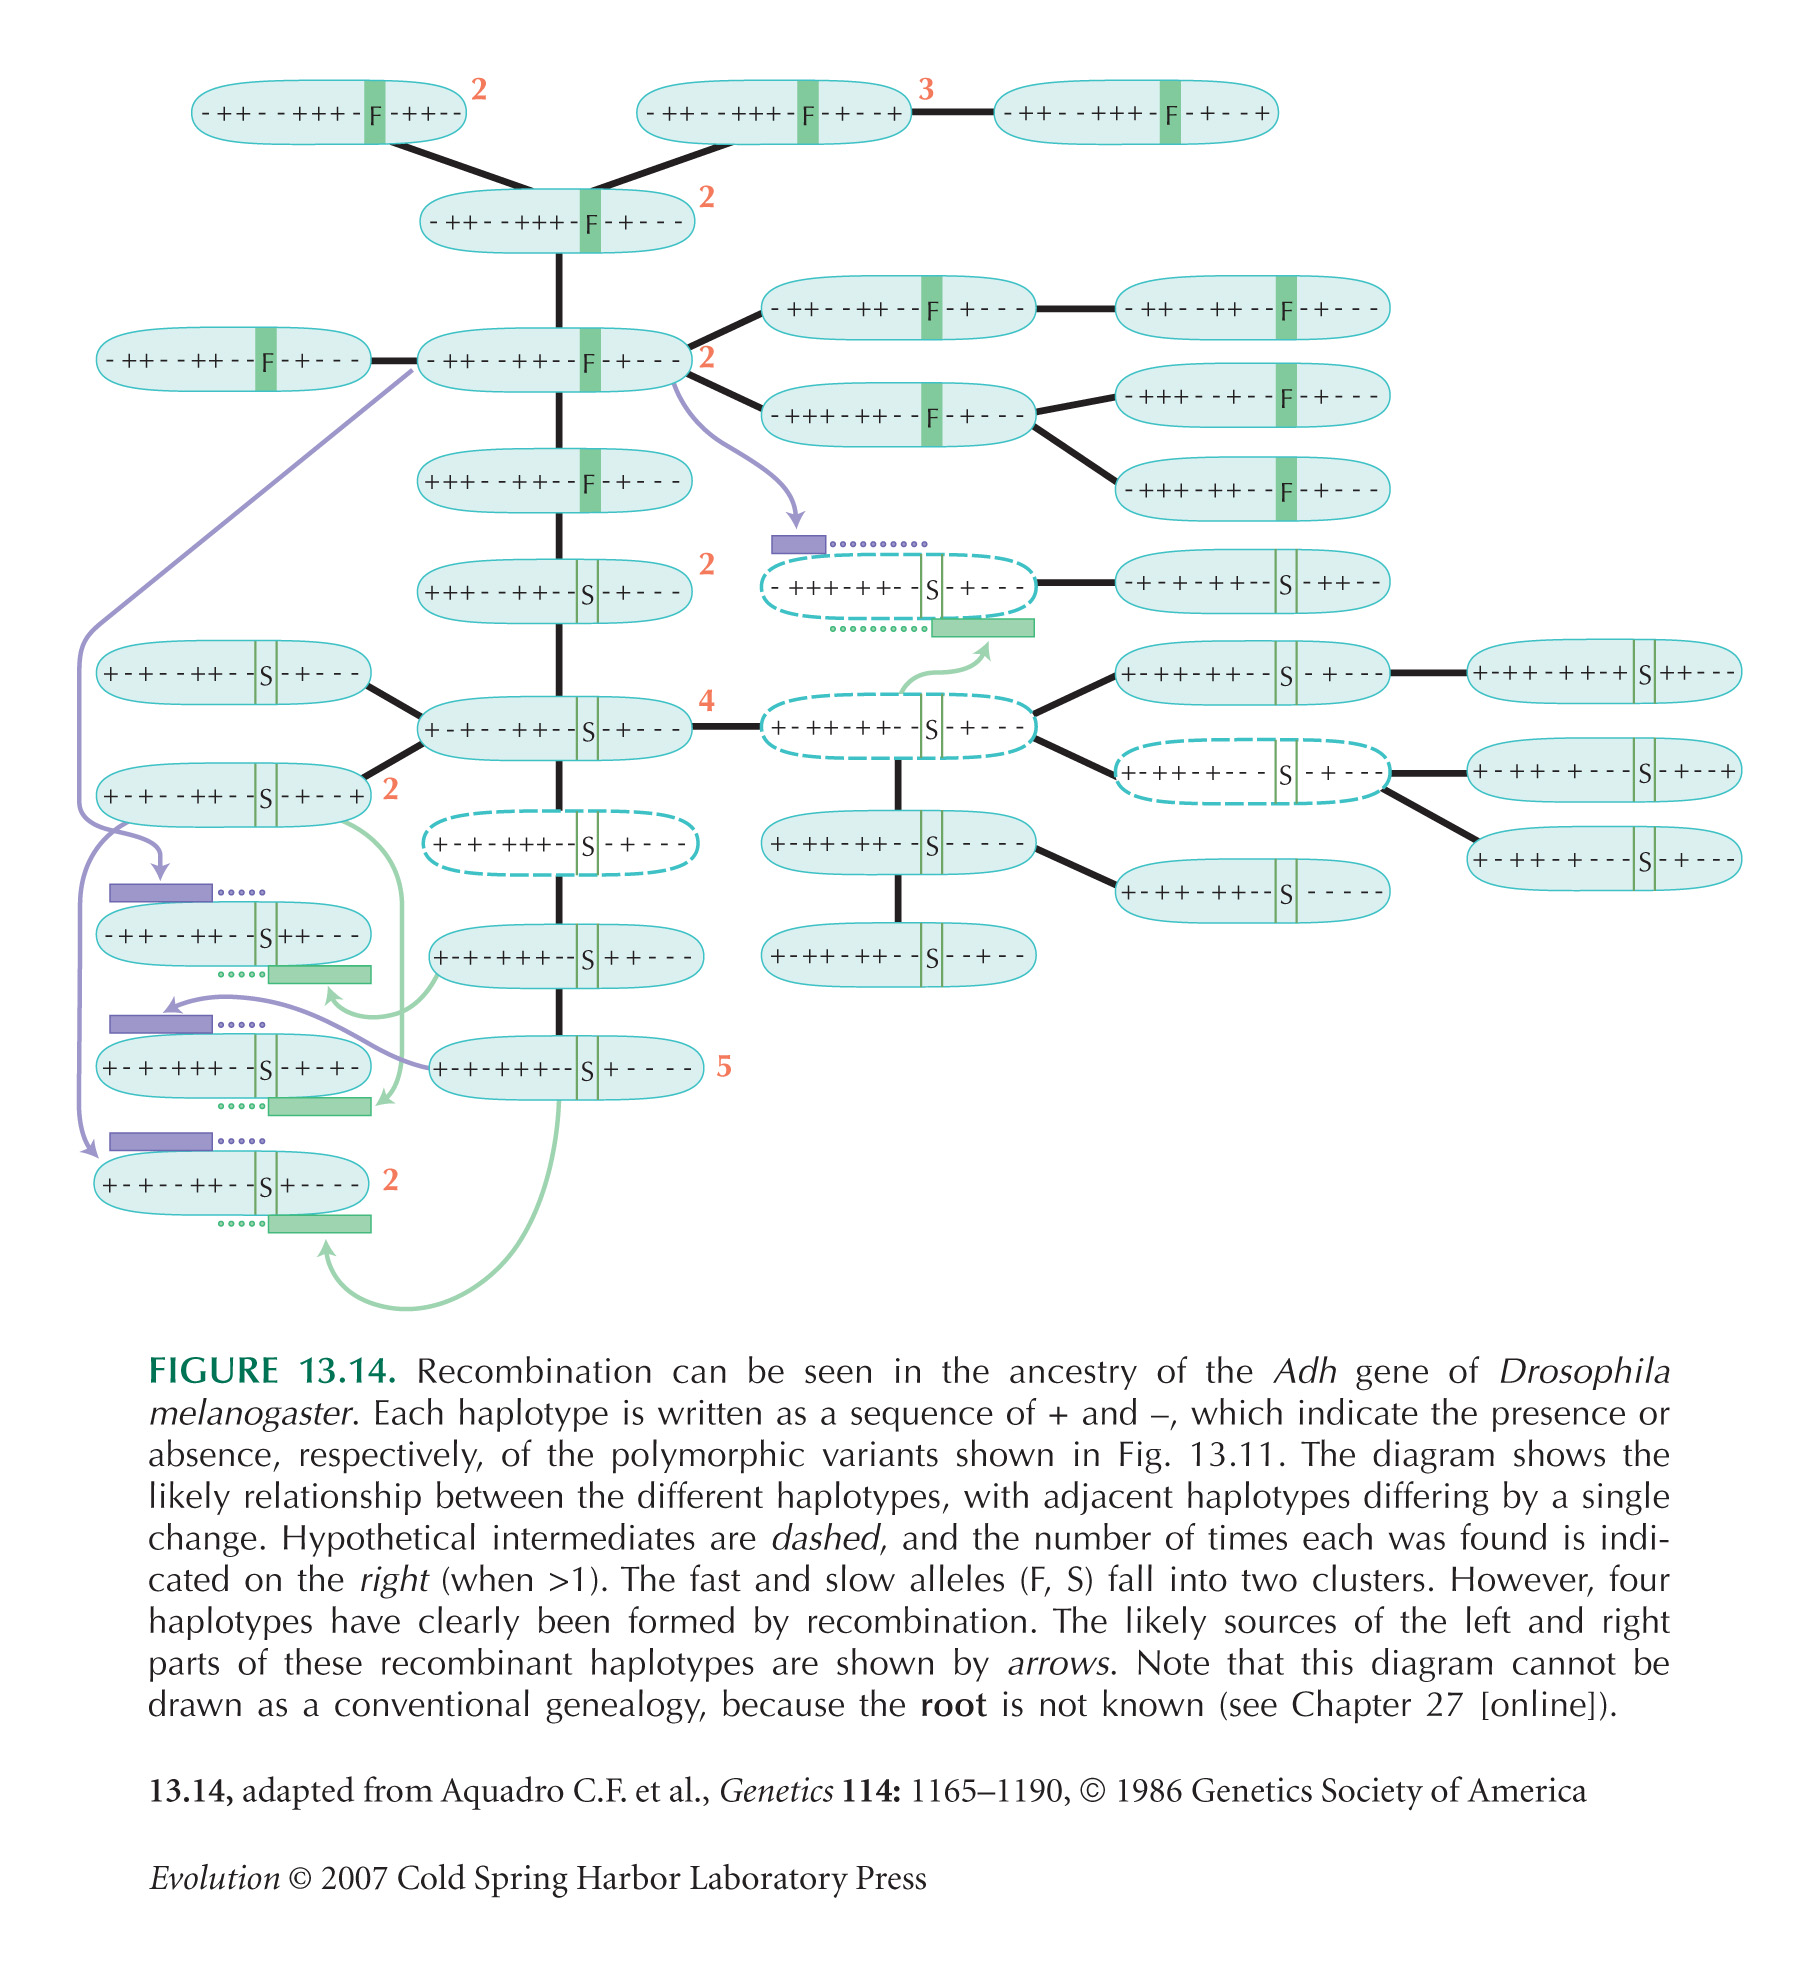
Note that the Drosophila alcohol dehydrogenase example of Figure 13.14 is from a region of low recombination. Thus, blocks of sequence that share the same ancestry are longer than the 50 bp calculated in the text, making it possible to discern them reasonably clearly.
Figure 15.16 is taken from Maynard Smith (1990).
The figure of 2 × 10⁻⁸ per base per generation for recombination rate in Drosophila is from Hey and Kliman (2002, Fig. 2b). Similar estimates are given in Andolfatto and Przeworski (2000). It is an average over males and females. Males have no recombination, and the rate in females is measured from laboratory crosses. (It is not straightforward to extract numbers from these papers: Hey and Kliman [2002] do not give units for R, and Andolfatto and Przeworski [2002] express recombination rate in terms of the product 2Nec.)
Associations between Pairs of Alleles Are Measured by Linkage Disequilibrium
The CCR5 example is taken from Stephens et al. (1998). See also Novembre et al. (2005). The estimate of allele age in the text is based on a very simple calculation and is highly uncertain, both because of the random location of recombination events and because of the randomness of reproduction.
There has been some controversy about the merits of different measures of linkage disequilibrium. For example, Lewontin (1988) argues that D depends on allele frequencies and that the ratio D/Dmax is more appropriate for comparing pairs of alleles with different frequencies. However, the appropriate measure depends on the question that is being asked. Often, the best approach is to fit a model of the evolutionary process rather than try to summarize complex data into a single measure (cf. Box 25.2).
The variance of pairwise linkage disequilibrium is derived by Avery and Hill (1979).
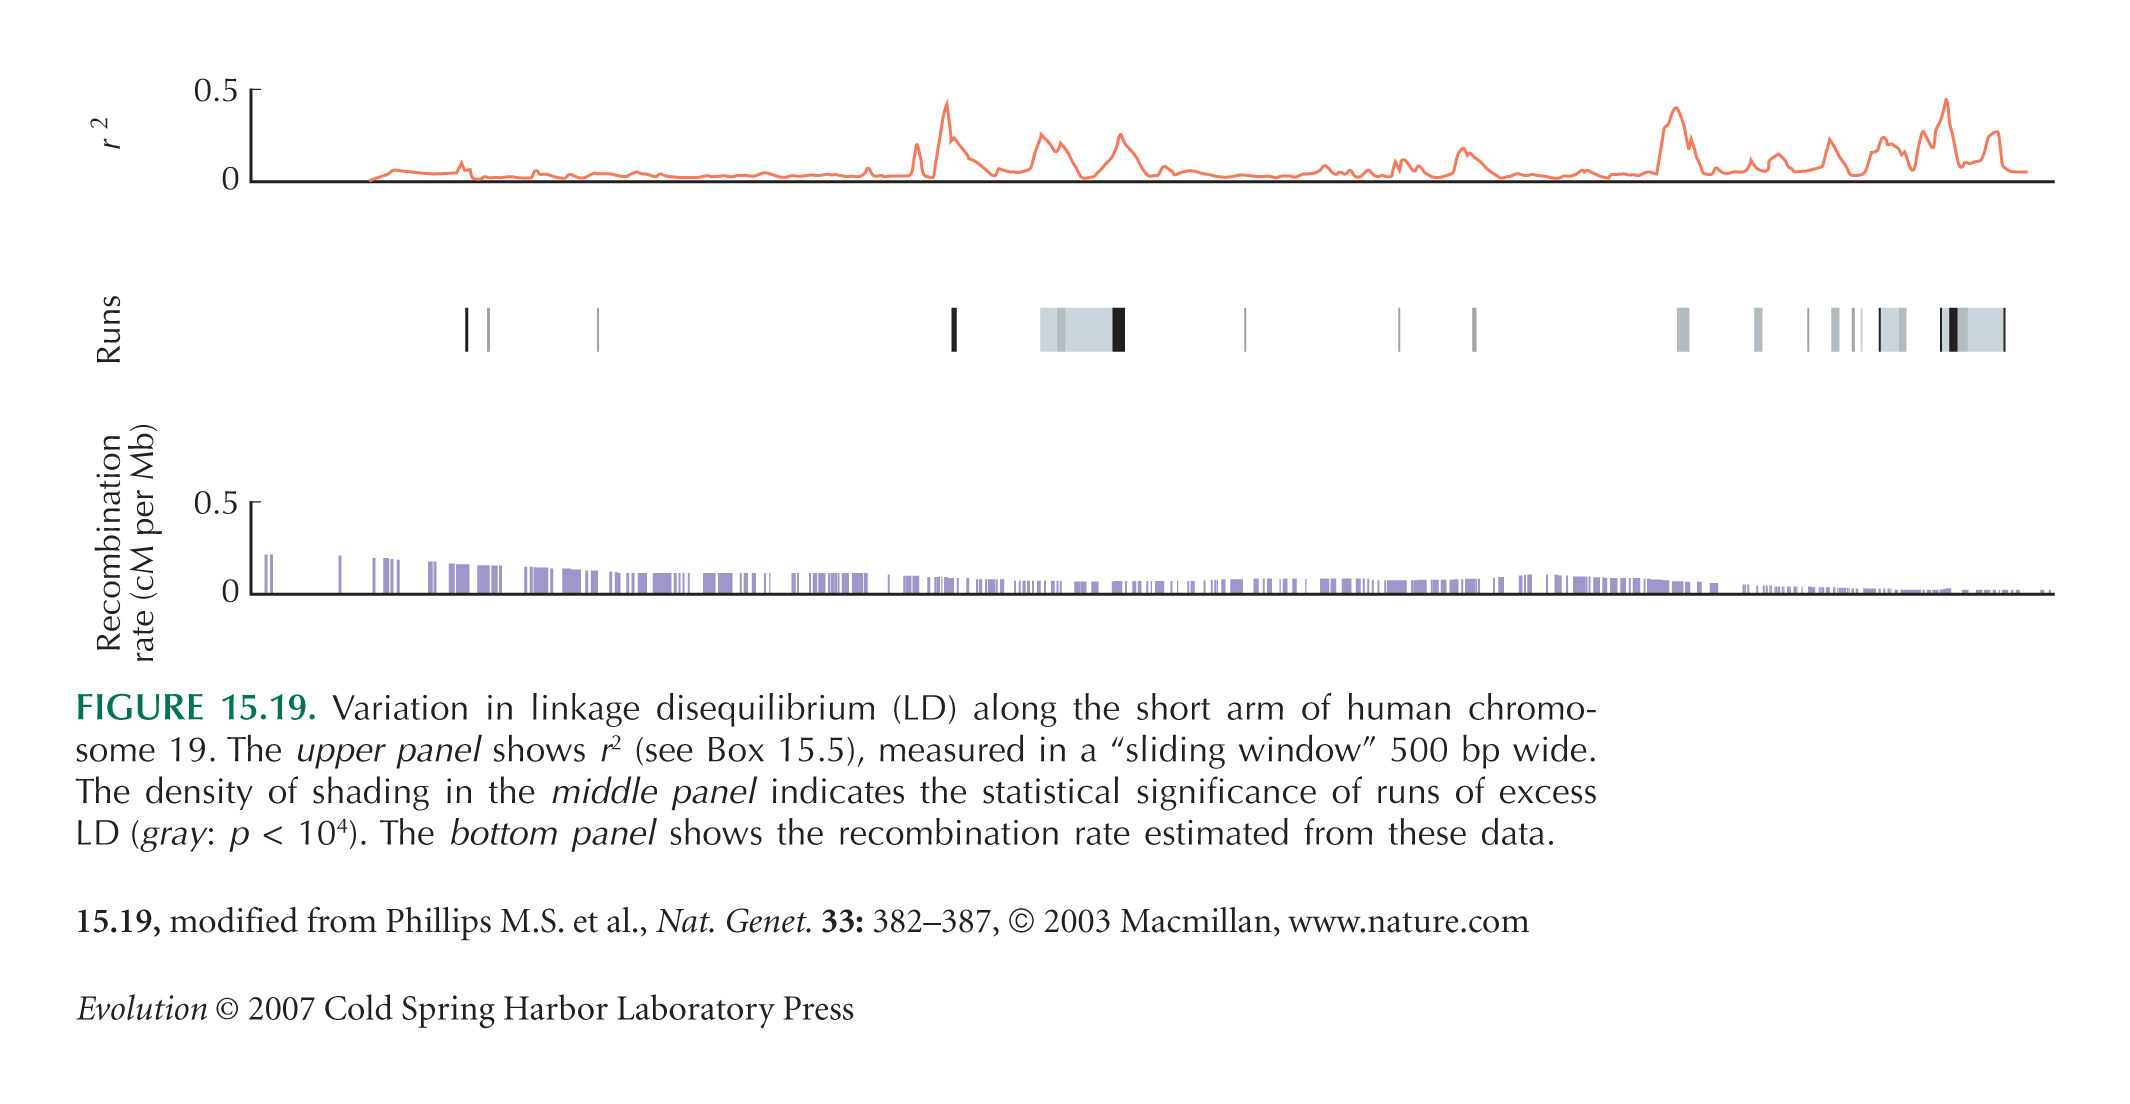
The Amount of Linkage Disequilibrium Varies Greatly along the Genome
Figure 15.19 is from Phillips et al. (2003). Because of its importance for human disease mapping, there is now a large literature on linkage disequilibrium in human populations (see, e.g., Ardlie et al. 2002).
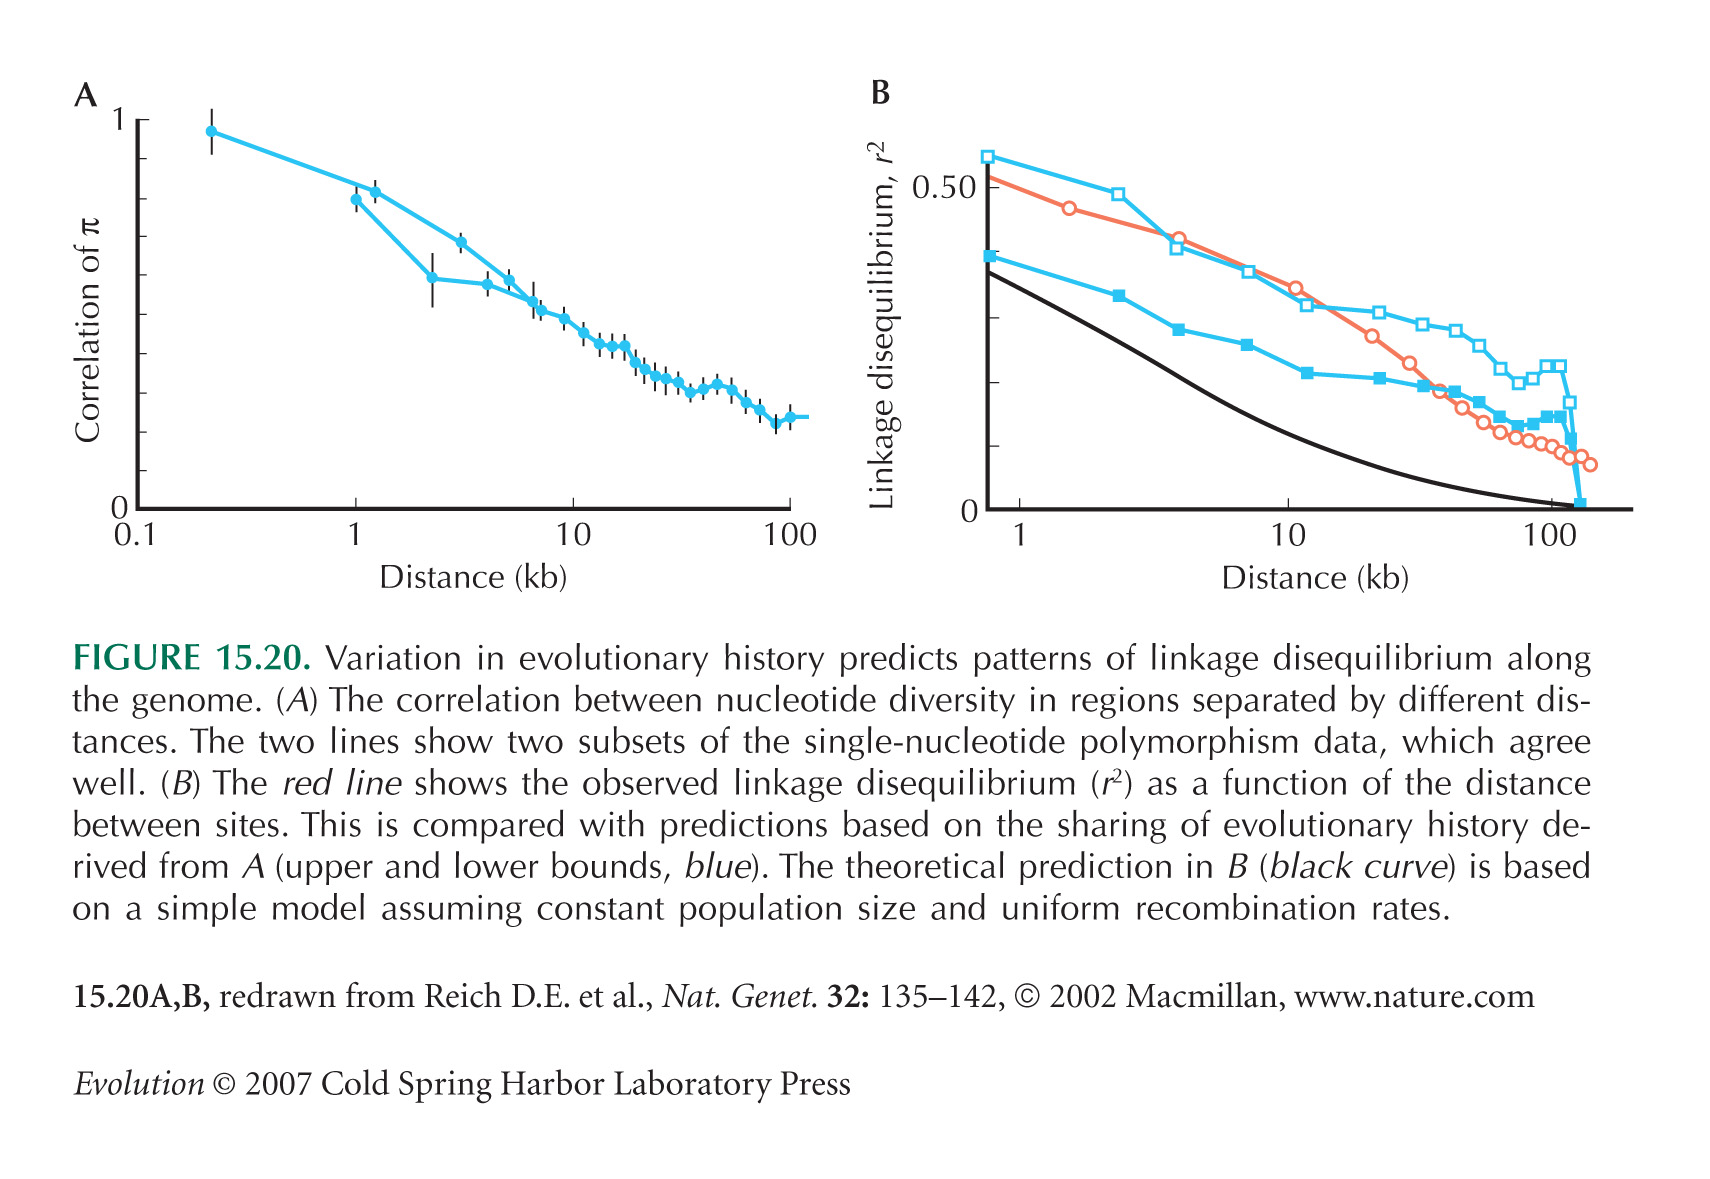
Figure 15.20 is from Reich et al. (2002). A similar excess of the extent of linkage disequilibrium along the genetic map, over that expected from measured recombination rates and estimates of Ne, is seen in Drosophila (Andolfatto and Przeworski 2000).
Direct evidence for recombination hot spots comes from typing human sperm (Jeffreys et al. 1998; Kauppi et al. 2003; Jeffreys and May 2004): These directly observed hot spots usually coincide with hot spots inferred from patterns of linkage disequilibrium (Myers et al. 2005). (However, there is evidence that the location of hot spots shifts over evolutionary time [Jeffreys et al. 2005].) Direct estimates from large pedigrees also show that most recombination is in hot spots (Coop et al. 2008). The consistency between different approaches shows that patterns of linkage disequilibrium can be explained by recombination hot spots, without any strong influence from population structure.
Robertson and Hill (1983, p. 263) first noted tentative evidence for excess linkage disequilibrium in humans and suggested the two alternative explanations discussed here: variation in recombination rate along the genome and population structure.
References
Andolfatto P. and Przeworski M. 2000. A genome-wide departure from the standard neutral model in natural populations of Drosophila. Genetics 156: 257–268.
Ardlie K.G., Kruglyak L., and Seielstad M. 2002. Patterns of linkage disequilibrium in the human genome. Nat. Rev. Genet. 3: 299–309.
Avery P.J. and Hill W.G. 1979. Distribution of linkage disequilibrium with selection and finite population size. Genet. Res. 33: 29–48.
Barton N.H. and Etheridge A.M. 2003. The distribution of surviving blocks of an ancestral genome. Theoret. Pop. Biol. 64: 451–472.
Brisson D. 2003. The directed mutation controversy in an evolutionary context. Crit. Rev. Microbiol. 29: 25–35.
Buri P. 1956. Gene frequency in small populations of mutant Drosophila. Evolution 10: 367–402.
Cann R.L., Stoneking M., and Wilson A.C. 1987. Mitochondrial DNA and human evolution. Nature 325: 31–35.
Chang J.T. 1999. Recent common ancestors of all present-day individuals. Adv. Appl. Probab. 31: 1002–1026.
Clayton G.C., Morris J.A., and Robertson A. 1957. An experimental check on quantitative genetic theory. I. Short term responses to selection. J. Genet. 55: 131–151.
Coop G., Wen X., Ober C., Pritchard J.K., and Przeworski M. 2008. High-resolution mapping of crossovers reveals extensive variation in fine-scale recombination patterns among humans. Science 319: 1395–1398.
Crow J.F. and Kimura M. 1970. An introduction to population genetics theory. Harper & Row, New York.
Derrida B., Manrubia S.C., and Zanette D.H. 1999. Statistical properties of genealogical trees. Phys. Rev. Lett. 82: 1987–1990.
Donnelly P. and Tavaré S. 1995. Coalescents and genealogical structure under neutrality. Annu. Rev. Genet. 29: 401–421.
Feil E.J. and Spratt B.G. 2001. Recombination and the population structures of bacterial pathogens. Annu. Rev. Microbiol. 55: 561–590.
Felsenstein J. Lecture Notes in Population Genetics. http://evolution.gs.washington.edu/index.html
Felsenstein J. 1992. Estimating effective population size from samples of sequences: Inefficiency of pairwise and segregating sites as compared to phylogenetic estimates. Genet. Res. 59: 139–147.
Foster P.L. 2004. Adaptive mutation in Escherichia coli. J. Bacteriol. 186: 4846–4852.
Fox M.S. 1998. Some recollections and reflections on mutation rates. Genetics 148: 1415–1418.
Gillespie J.H. 2000. Genetic drift in an infinite population: The pseudohitchhiking model. Genetics 155: 909–919.
Gillespie J.H. 2001. Is the population size of a species relevant to its evolution? Evolution 55: 2161–2169.
Gupta S. and Maiden M.C.J. 2001. Exploring the evolution of diversity in pathogen populations. Trends Microbiol. 9: 181–185.
Hein J., Schierup M., and Wiuf C. 2005. Gene genealogies, variation and evolution: A primer in coalescent theory. Oxford University Press, Oxford.
Hey J. and Kliman R.M. 2002. Interactions between natural selection, recombination and gene density in the genes of Drosophila. Genetics 160: 595–608.
Jeffreys A.J. and May C.A. 2004. Intense and highly localized gene conversion activity in human meiotic crossover hot spots. Nat. Genet. 36: 151–156.
Jeffreys A.J., Murray J., and Neumann R. 1998. High-resolution mapping of crossovers in human sperm defines a minisatellite-associated recombination hotspot. Mol. Cell 2: 267–273.
Jeffreys A.J., Neuman R., Panayi M., Myers S., and Donnelly P. 2005. Human recombination hot spots hidden in regions of strong marker association. Nat. Genet. 37: 601–606.
Judson H.F. 1995. The eighth day of creation. Penguin, London.
Kauppi L., Sajantila A., and Jeffreys A.J. 2003. Recombination hotspots rather than population history dominate linkage disequilibrium in the MHC class II region. Hum. Mol. Genet. 12: 33–40.
Kerr W.E. and Wright S. 1954. Experimental studies of the distribution of gene frequencies in very small populations of Drosophila melanogaster. I–III. Evolution 8: 172–177, 225–240, 293–202.
Kimura M. 1968. Evolutionary rate at the molecular level. Nature 217: 624–626.
King J.L. and Jukes T.H. 1968. Non-Darwinian evolution. Science 164: 788–798.
Lewontin R.C. 1988. On measures of gametic disequilibrium. Genetics 120: 849–852.
Luria S.E. and Delbrück M. 1943. Mutations of bacteria from virus sensitivity to virus resistance. Genetics 28: 491–511.
Maynard Smith J. 1990. The evolution of prokaryotes—Does sex matter? Annu. Rev. Ecol. Syst. 21: 1–12.
Maynard Smith J. and Haigh J. 1974. The hitch-hiking effect of a favourable gene. Genet. Res. 23: 23–35.
Myers S., Bottolo L., Freeman C., McVean G., and Donnelly P. 2005. A fine-scale map of recombination rates and hotspots across the human genome. Science 310: 321–324.
Novembre J., Galvani A., and Slatkin M. 2005. The geographic spread of the CCR5 Δ32 HIV-resistance allele. PLoS Biol. 3: (e339) 1954–1962.
Nunney L. 1994. The influence of mating system and overlapping generations on effective population size. Evolution 47: 1329–1341.
Patil N., Berno A.J., Hinds D.A., Barrett W.A., Doshi J.M., et al. 2001. Blocks of limited haplotype diversity revealed by high-resolution scanning of human chromosome 21. Science 294: 1719–1723.
Phillips M.S., Lawrence R., Sachidanandam R., Morris A.P., Balding D.J., et al. 2003. Chromosome-wide distribution of haplotype blocks and the role of recombination hot spots. Nat. Genet. 33: 382–387.
Reich D.E., Schaffner S.F., Daly M.J., McVean G.A.T., Mullikin J.C., Higgins J.M., Richter D.J., Lander E.S., and Altshuler D. 2002. Human genome sequence variation and the influence of gene history, mutation and recombination. Nat. Genet. 32: 135–142.
Rich S.S., Bell A.E., Miles D.A., and Wilson S.P. 1984. An experimental study of genetic drift for two quantitative characters in Tribolium. J. Hered. 75: 191–195.
Robertson A. 1967. The nature of quantitative genetic variation. In Heritage from Mendel (ed. R.A. Brink), pp. 265–280. University of Wisconsin Press, Madison.
Robertson A. and Hill W.G. 1983. Population and quantitative genetics of many linked loci in finite populations. Proc. R. Soc. Lond. B 219: 253–264.
Rohde D.L.T., Olson S., and Chang J.T. 2004. Modelling the recent common ancestry of all living humans. Nature 431: 562–566.
Rosenberg N.A. and Nordborg M. 2002. Genealogical trees, coalescent theory and the analysis of genetic polymorphisms. Nat. Rev. Genet. 3: 380–390.
Rosenberg S.M. 2001. Evolving responsively: Adaptive mutation. Nat. Rev. Genet. 2: 504–512.
Roth J.R., Kugelberg E., Reams A.B., Kofoid E., and Andersson D.I. 2006. Origin of mutation under selection: The adaptive mutation controversy. Ann. Rev. Microbiol. 60: 477–501.
Sachidanandam R., Weissman D., Schmidt S.C., Kakol J.M., Stein L.D., et al. The International SNP Map Working Group. 2001. A map of human genome sequence variation containing 1.42 million single nucleotide polymorphisms. Nature 409: 928–933.
Selander R.K. and Levin B.R. 1980. Genetic divergence and structure in Escherichia coli populations. Science 210: 545–547.
Sharp P.M. and Li W.H. 1989. On the rate of DNA sequence evolution in Drosophila. J. Mol. Evol. 28: 398–402.
Stephens J.C., et al. 1998. Dating the origin of the CCR5-Delta 32 AIDS-resistance allele by the coalescence of haplotypes. Am. J. Human Genet. 62: 1507–1515.
Vucetich J.A., Waite T.A., and Nunney L. 1997. Fluctuating population size and the ratio of effective to census population size. Evolution 51: 2017–2021.
Wakeley J. 2008. Coalescent theory: An introduction. Roberts and Company, Englewood, Colorado.
|


