Chapter 13 Notes
Variation in DNA and Proteins
Introduction
The estimated total number of 2.3 million differences between two randomly chosen human genomes comes from an average diversity of π ~ 0.0008 per site, multiplied by a genome length of approximately 2.9 × 10⁹ bp (Reich et al. 2002). The estimated number of 11,000 amino acid differences comes from multiplying the fraction of coding sequence (1.5%) by the average nucleotide diversity in exons (0.0005) and the fraction of sequence variants that alter amino acid sequence (~50%) (Bentley 2003). Bentley (2003) estimates that the global human population contains about 90,000 amino acid variants with allele frequency >1%.
Genetic Variation
Evolution Requires Genetic Variation
As we saw in Chapter 1, systematic study of variation came surprisingly late. Although Francis Galton developed the statistical tools needed to describe variation, these were taken up by only a few people, primarily Ralph Weldon and Karl Pearson. In contrast, the early geneticists mainly investigated the inheritance of major mutations in artificial crosses, rather than studying natural populations; they regarded the origin of species as equivalent to the origin of mutations and did not appreciate the importance of variation within natural populations. The shift away from what Ernst Mayr termed “typological thinking,” in which species are seen as homogeneous “types,” only came with the Evolutionary Synthesis (p. 30).
A gene is typically present in all individuals; however, there are exceptions. For example, Y-linked genes are only present in males, and sometimes there are polymorphic deletions. Figure 13.32 and Sebat et al. (2004).
Box 13.1 Genetic Terminology
Sometimes, allele P at locus 1 would be written P1, and a haploid genotype involving three loci would be written P1Q2Q3. We use the alternative APBQCQ because this is consistent with standard genetic notation. However, usage differs widely in population genetics.
FlyBase is a comprehensive database on the genetics of Drosophila species. As of August 2, 2007, FlyBase listed 1622 alleles at the white gene of Drosophila melanogaster.
Classical Genetics Revealed Cryptic Variation
Cystic fibrosis has an incidence of up to 1 in 2000 in European populations, corresponding to a frequency of heterozygous carriers of about 1 in 23. (Cystic fibrosis alleles are close to Hardy–Weinberg proportions; see Problem 13.1.) However, the detailed review of cystic fibrosis in the OMIM database gives widely varying estimates of incidence and carrier frequency for a variety of ethnic groups: for example, 1/2000 in Scotland and in Brittany, 1/4000 in The Netherlands, and 1/3700 for white children in Ohio.
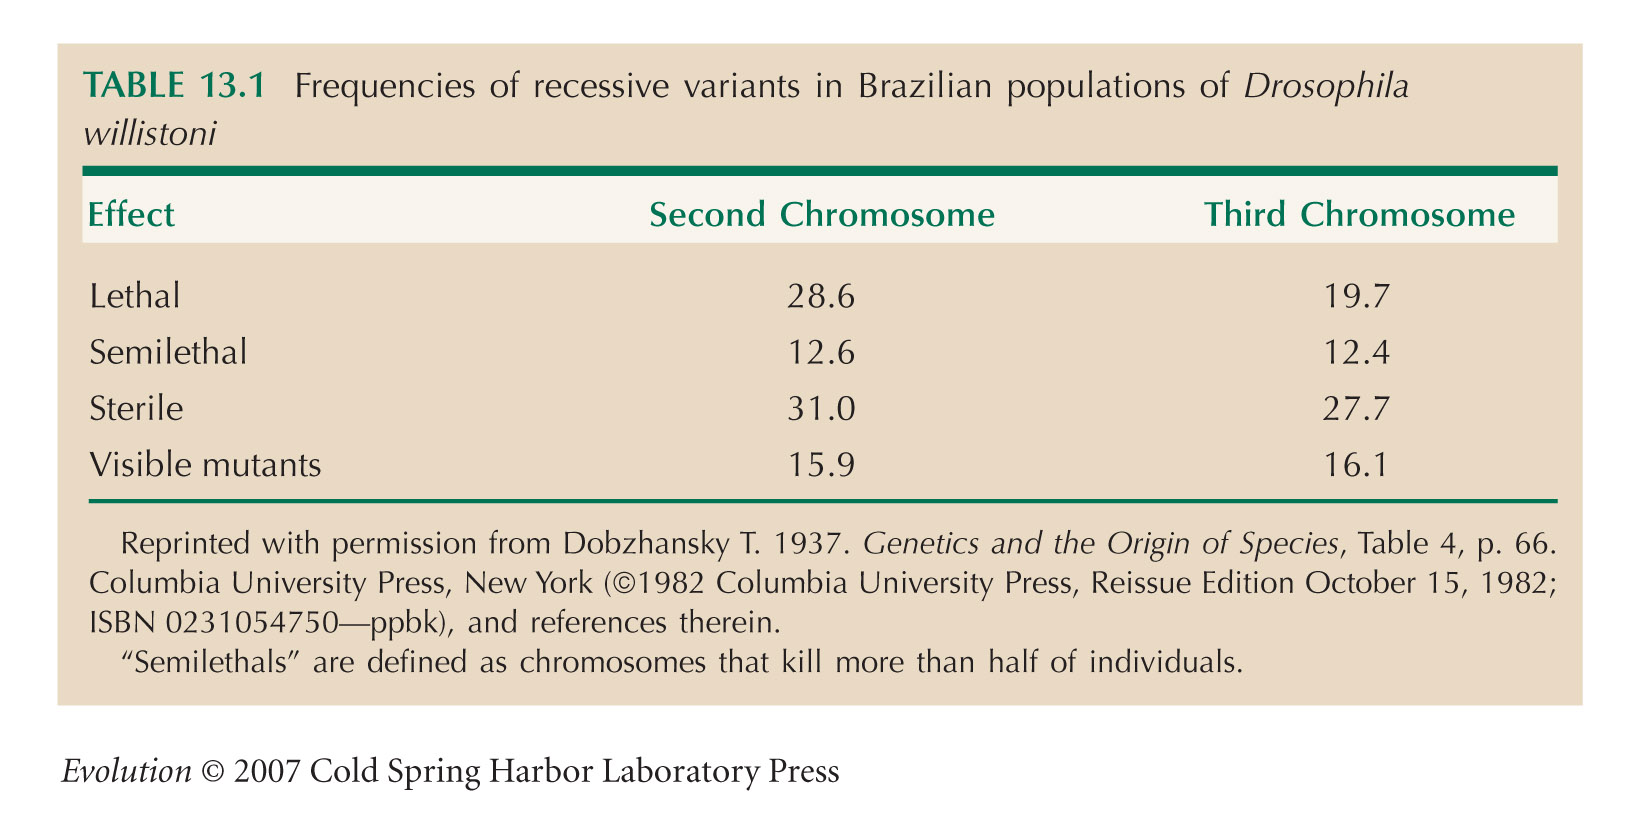
Table 13.1, on recessive variants in natural Drosophila willistoni populations, is from Table 4 (p. 66) of Dobzhansky (1937) and is based on data from Pavan et al. (1951). This and similar evidence on cryptic variation is reviewed by Dobzhansky (1937); for a recent review, see Gibson and Dworkin (2004).
Dobzhansky’s series of papers on The Genetics of Natural Populations have been collected by Lewontin et al. (1981), together with historical commentaries. This is the best source for understanding the early evidence for genetic variation in nature.
Numbers for the frequencies and allelism of recessive lethals in Drosophila pseudoobscura are from Wright et al. (1942). Their estimate of 300 genes on the second chromosome is much lower than the actual number (currently estimated as about 3100). This is because most genes are not essential and so do not give recessive lethal alleles even when deleted. More generally, variation in the rate of mutation to recessive lethals makes the “effective number” of genes estimated by Wright et al. (1942) an underestimate. For a more recent application of their method, see Bishop et al. (1981).
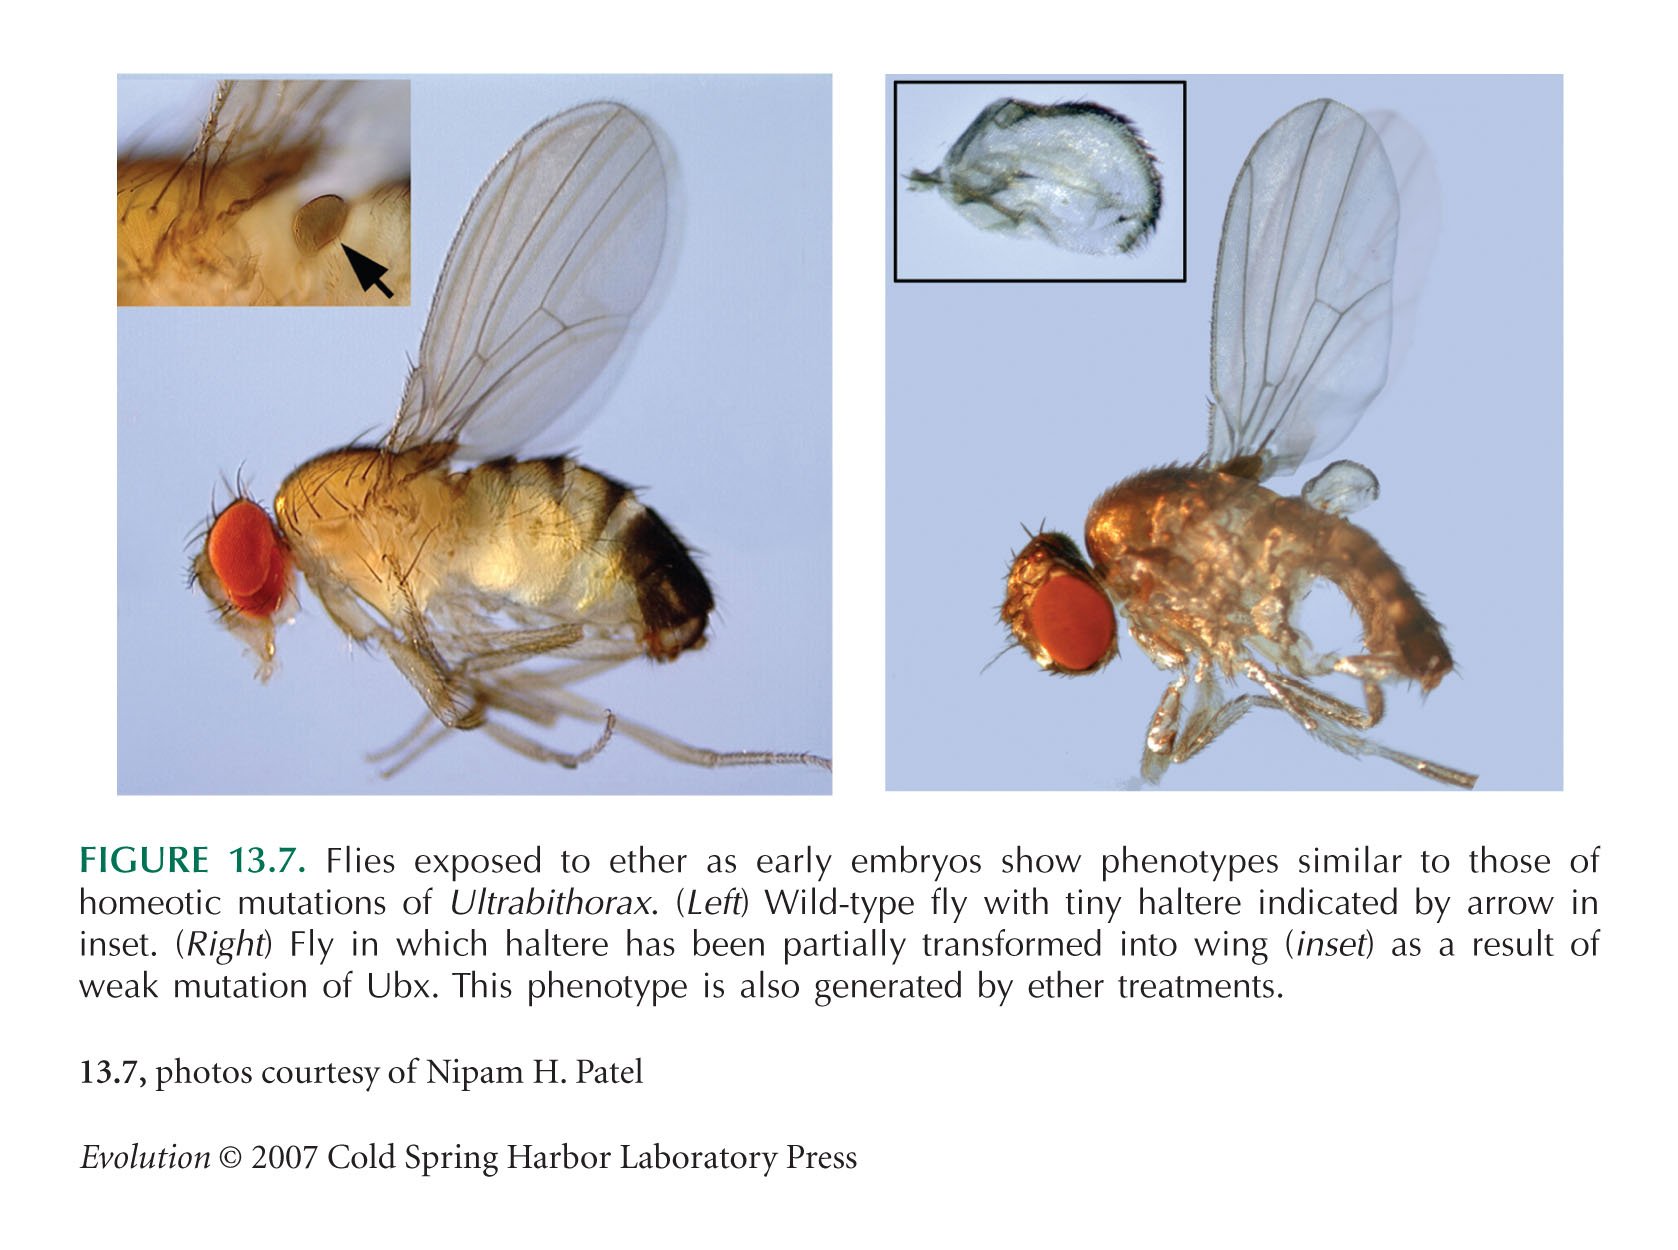
The example of Figure 13.7, involving variation in Ultrabithorax, is from Gibson and Hogness (1996), and follows from experiments by Waddington (1956). For a review, see Gibson and Dworkin (2004).
Members of a Population Differ Extensively in Protein and DNA Sequence
The first electrophoretic surveys to reveal extensive variation were by Harris (1966) in humans and Lewontin and Hubby (1966) in Drosophila. Lewontin (1974) gives a critical review of the early findings.
The survey of 1.42 million single nucleotide polymorphisms (SNPs) is described by Sachidanandam et al. (2001).
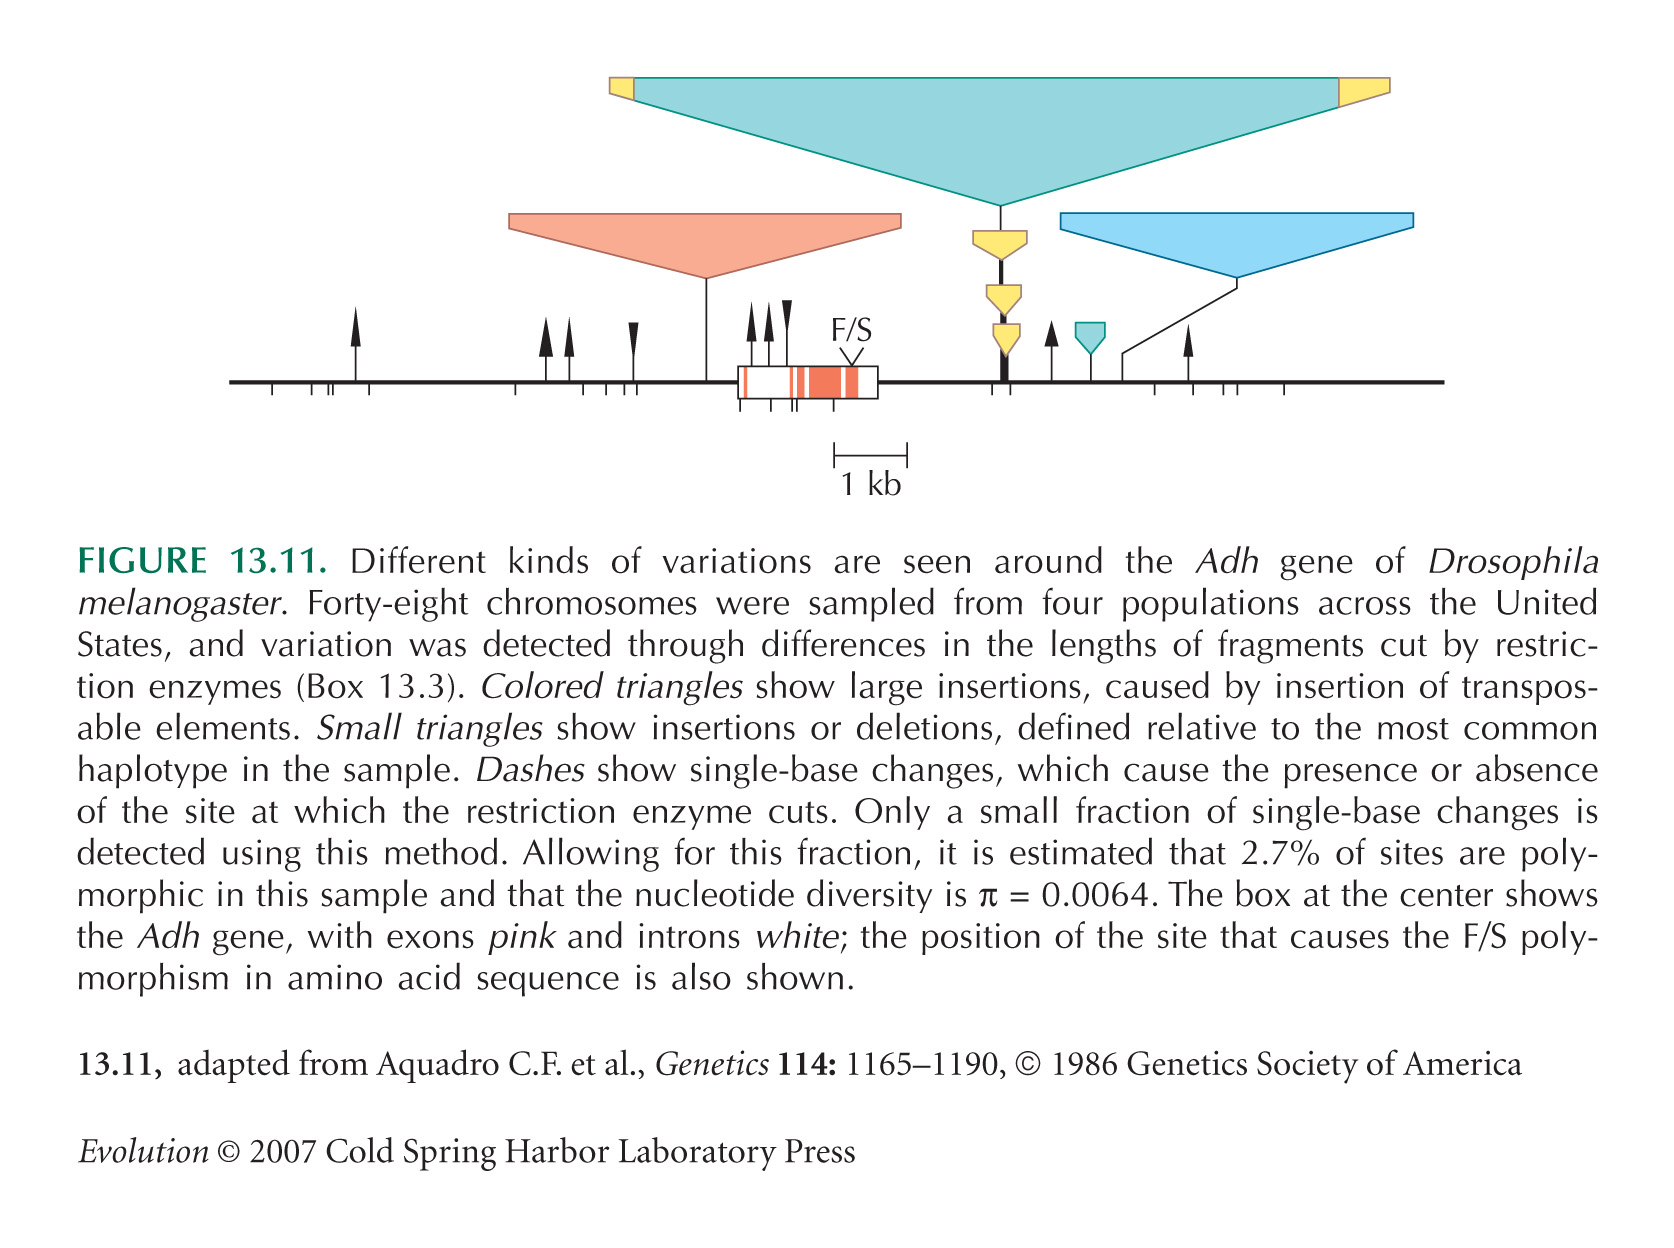
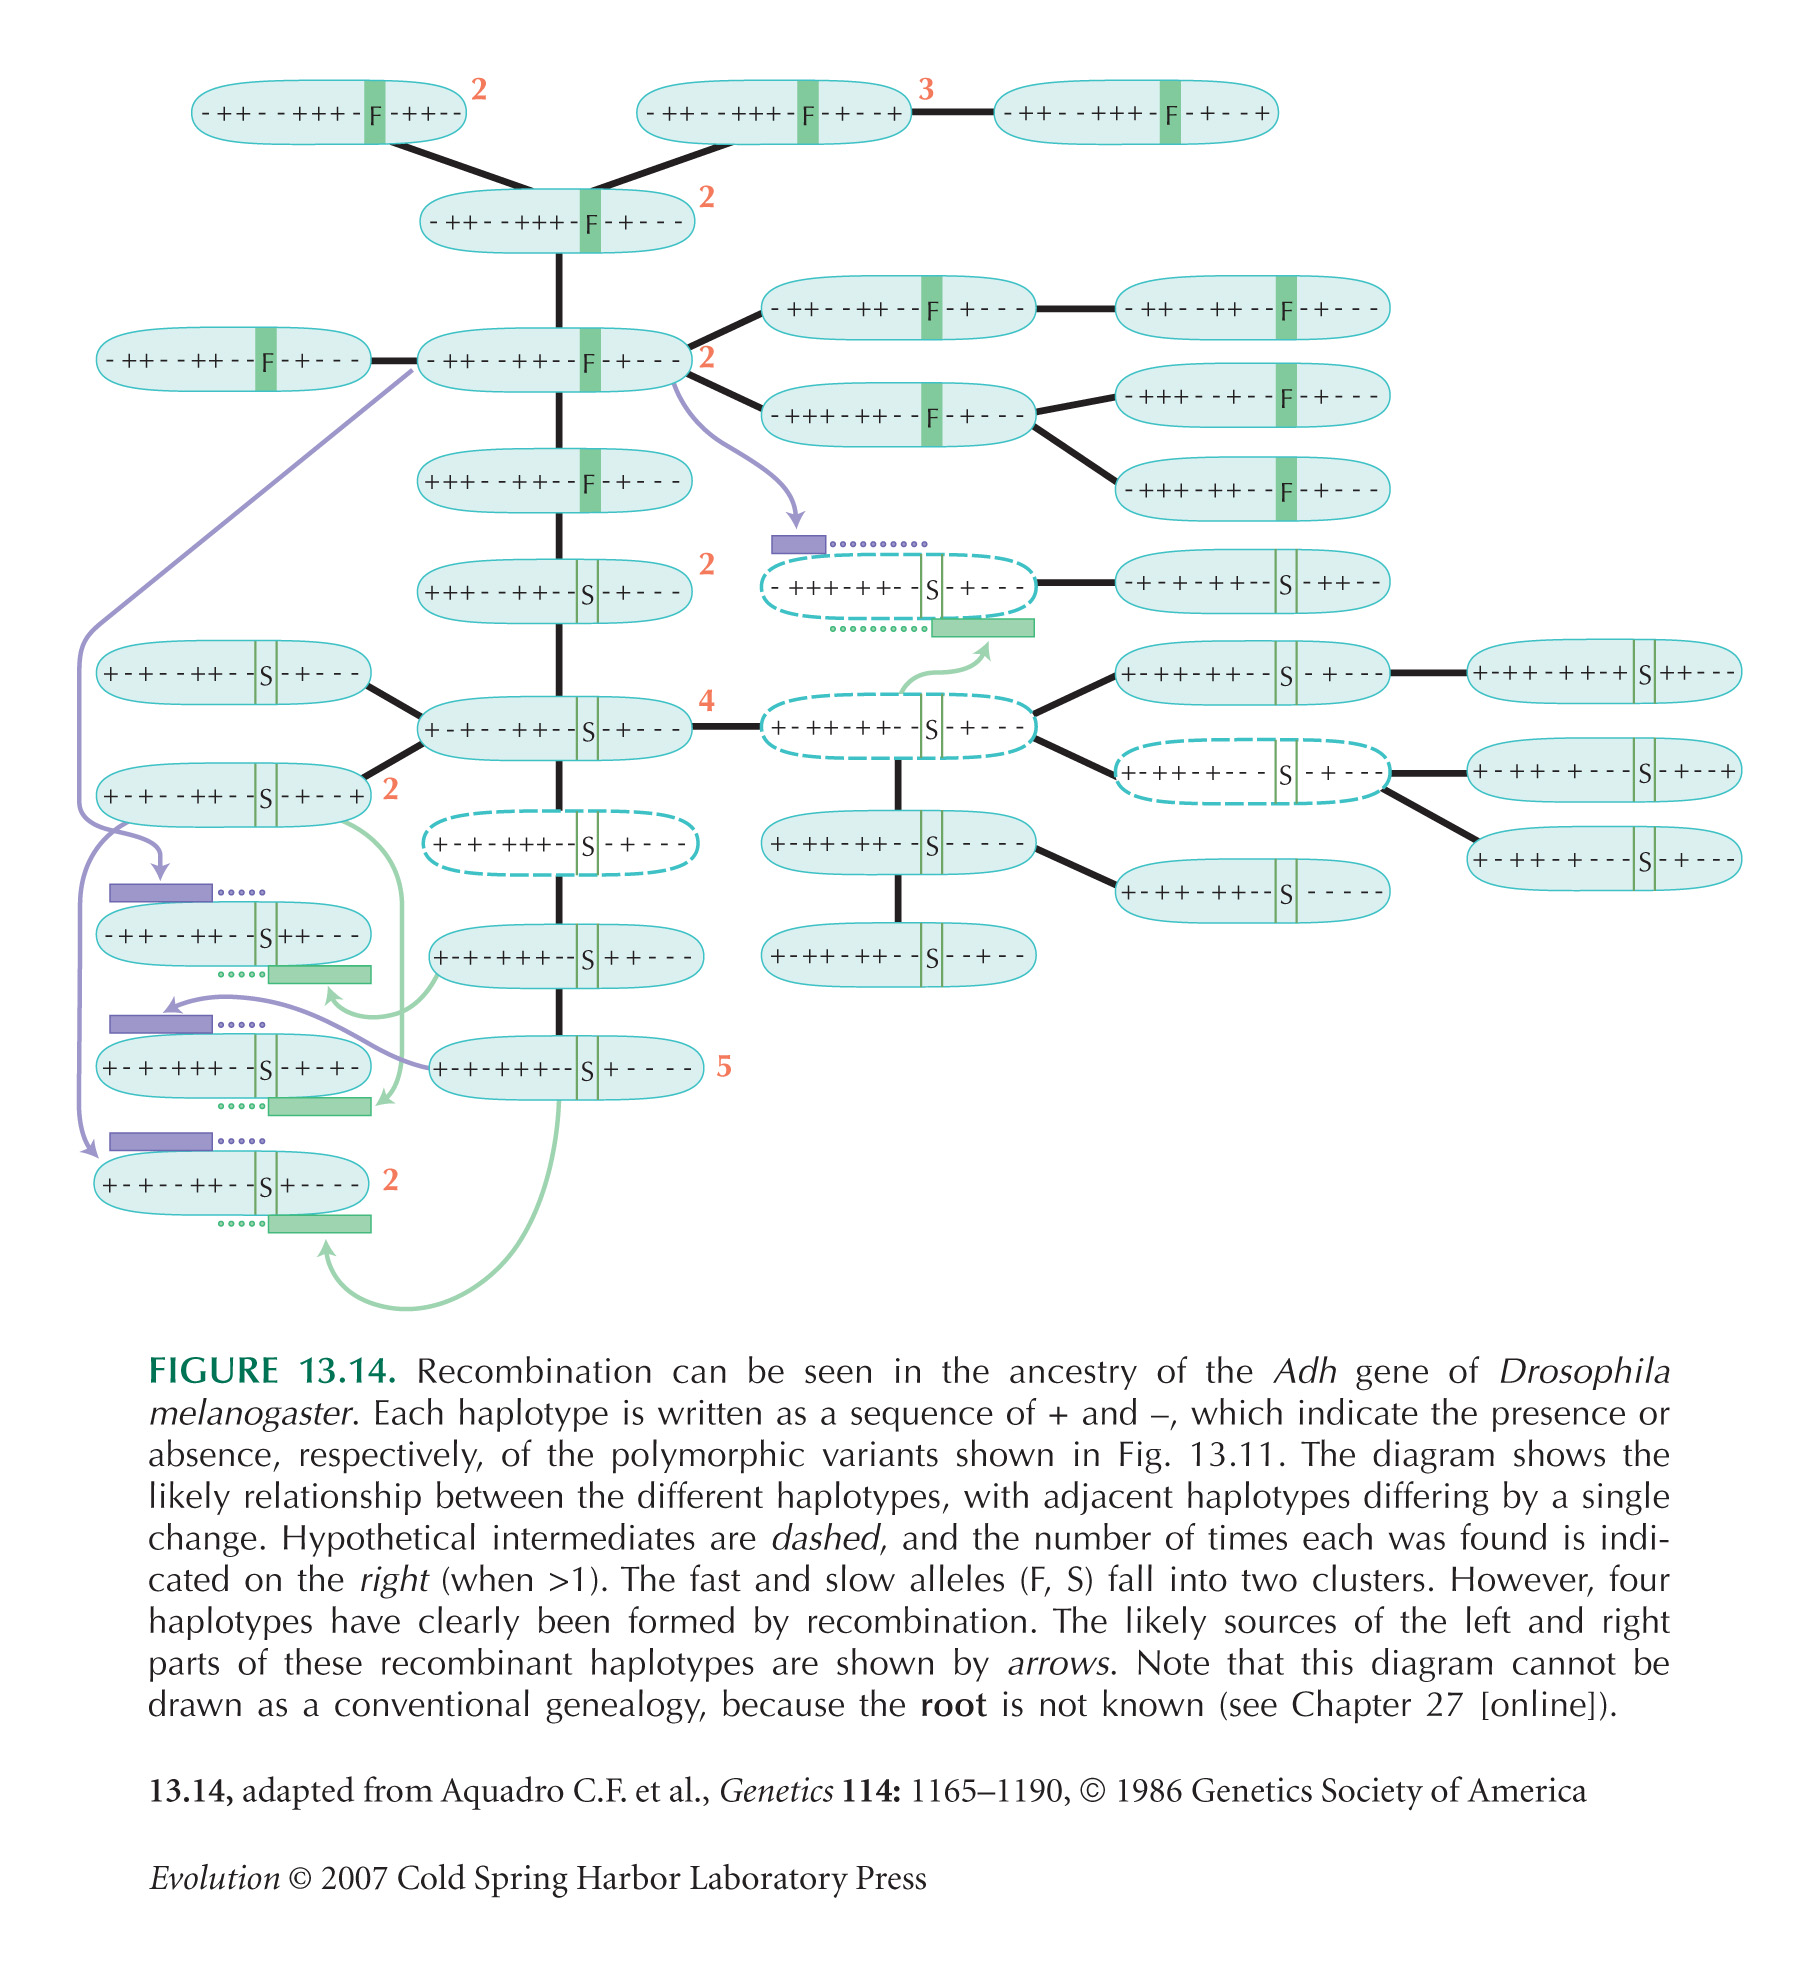
The Adh example of Figures 13.11 and 13.14 is from Aquadro et al. (1986).
Box 13.3 Genetic Markers
The values for π ~ 0.0008 in humans are given by Cargill et al. (1999). It is substantially lower than the estimate given by Reich et al. (2002) (π ~ 0.0005). This difference could be because Cargill et al. (1999) look near to genes; however, they state that studies of random DNA give similar figures. As they note in their Discussion, the explanation is instead that Reich et al. (2002) include African diversity. Their figure of 0.0008 originates from the study of Halushka et al. (1999) that included Europeans and Africans in equal number, and also from the Sachidanandam et al. (2001) survey of 1.42 million SNPs, which was based on 24 individuals of diverse origin.
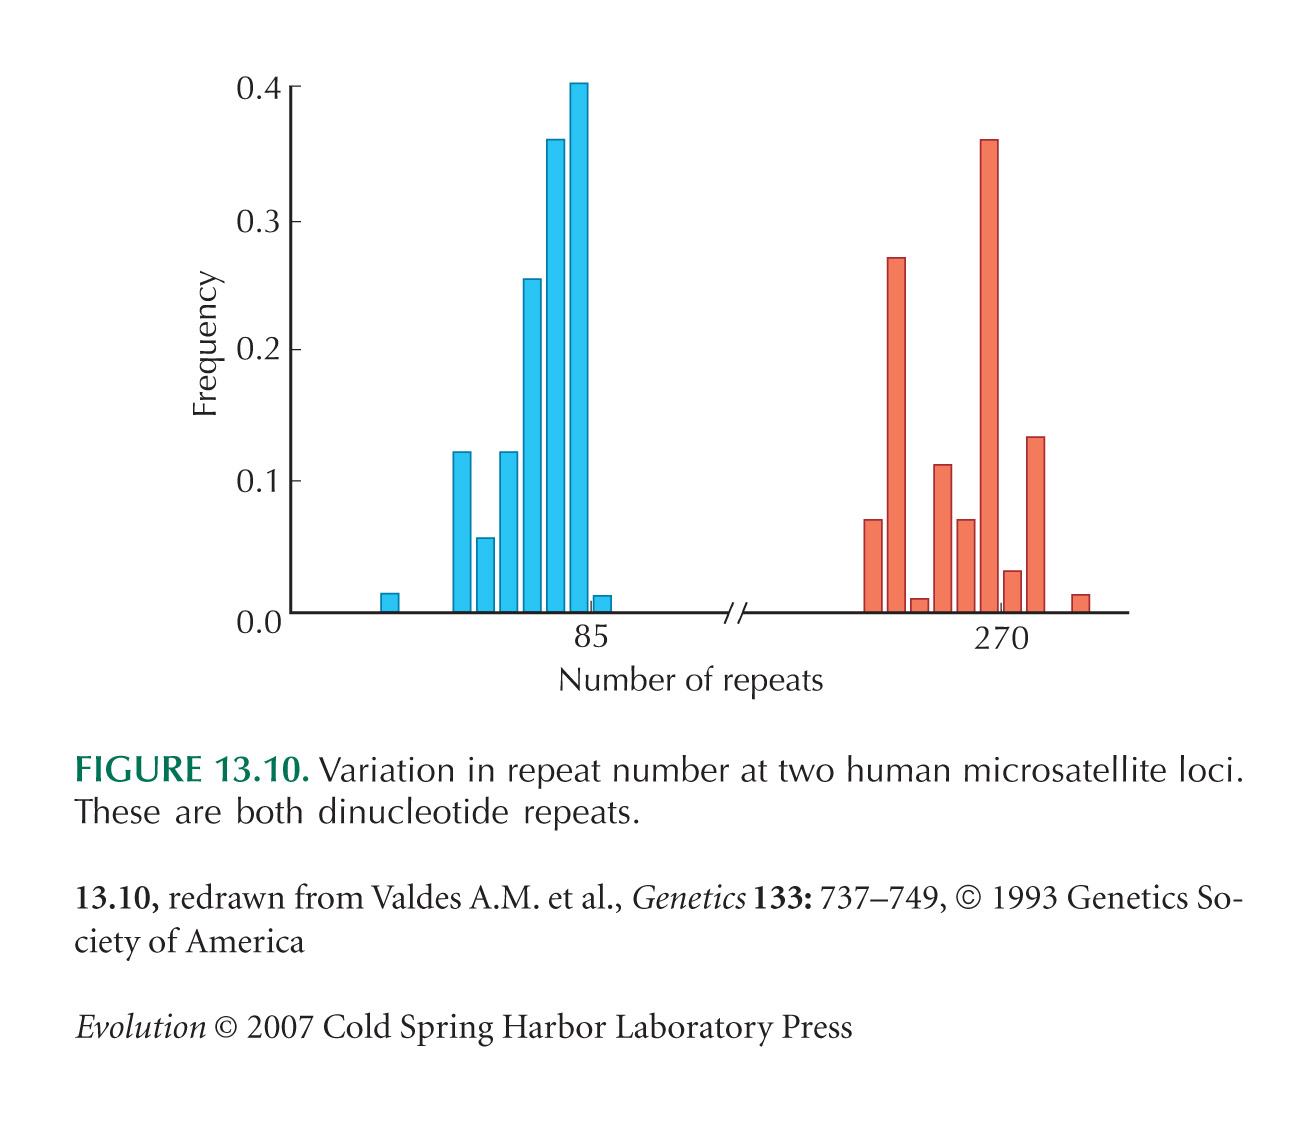
Figure 13.10 is from Valdes et al. (1993).
Data for SNP numbers and diversity in Box 13.3 are from Bentley (2003).
Types of Genetic Variation
Most Populations Contain Abundant Genetic Variation
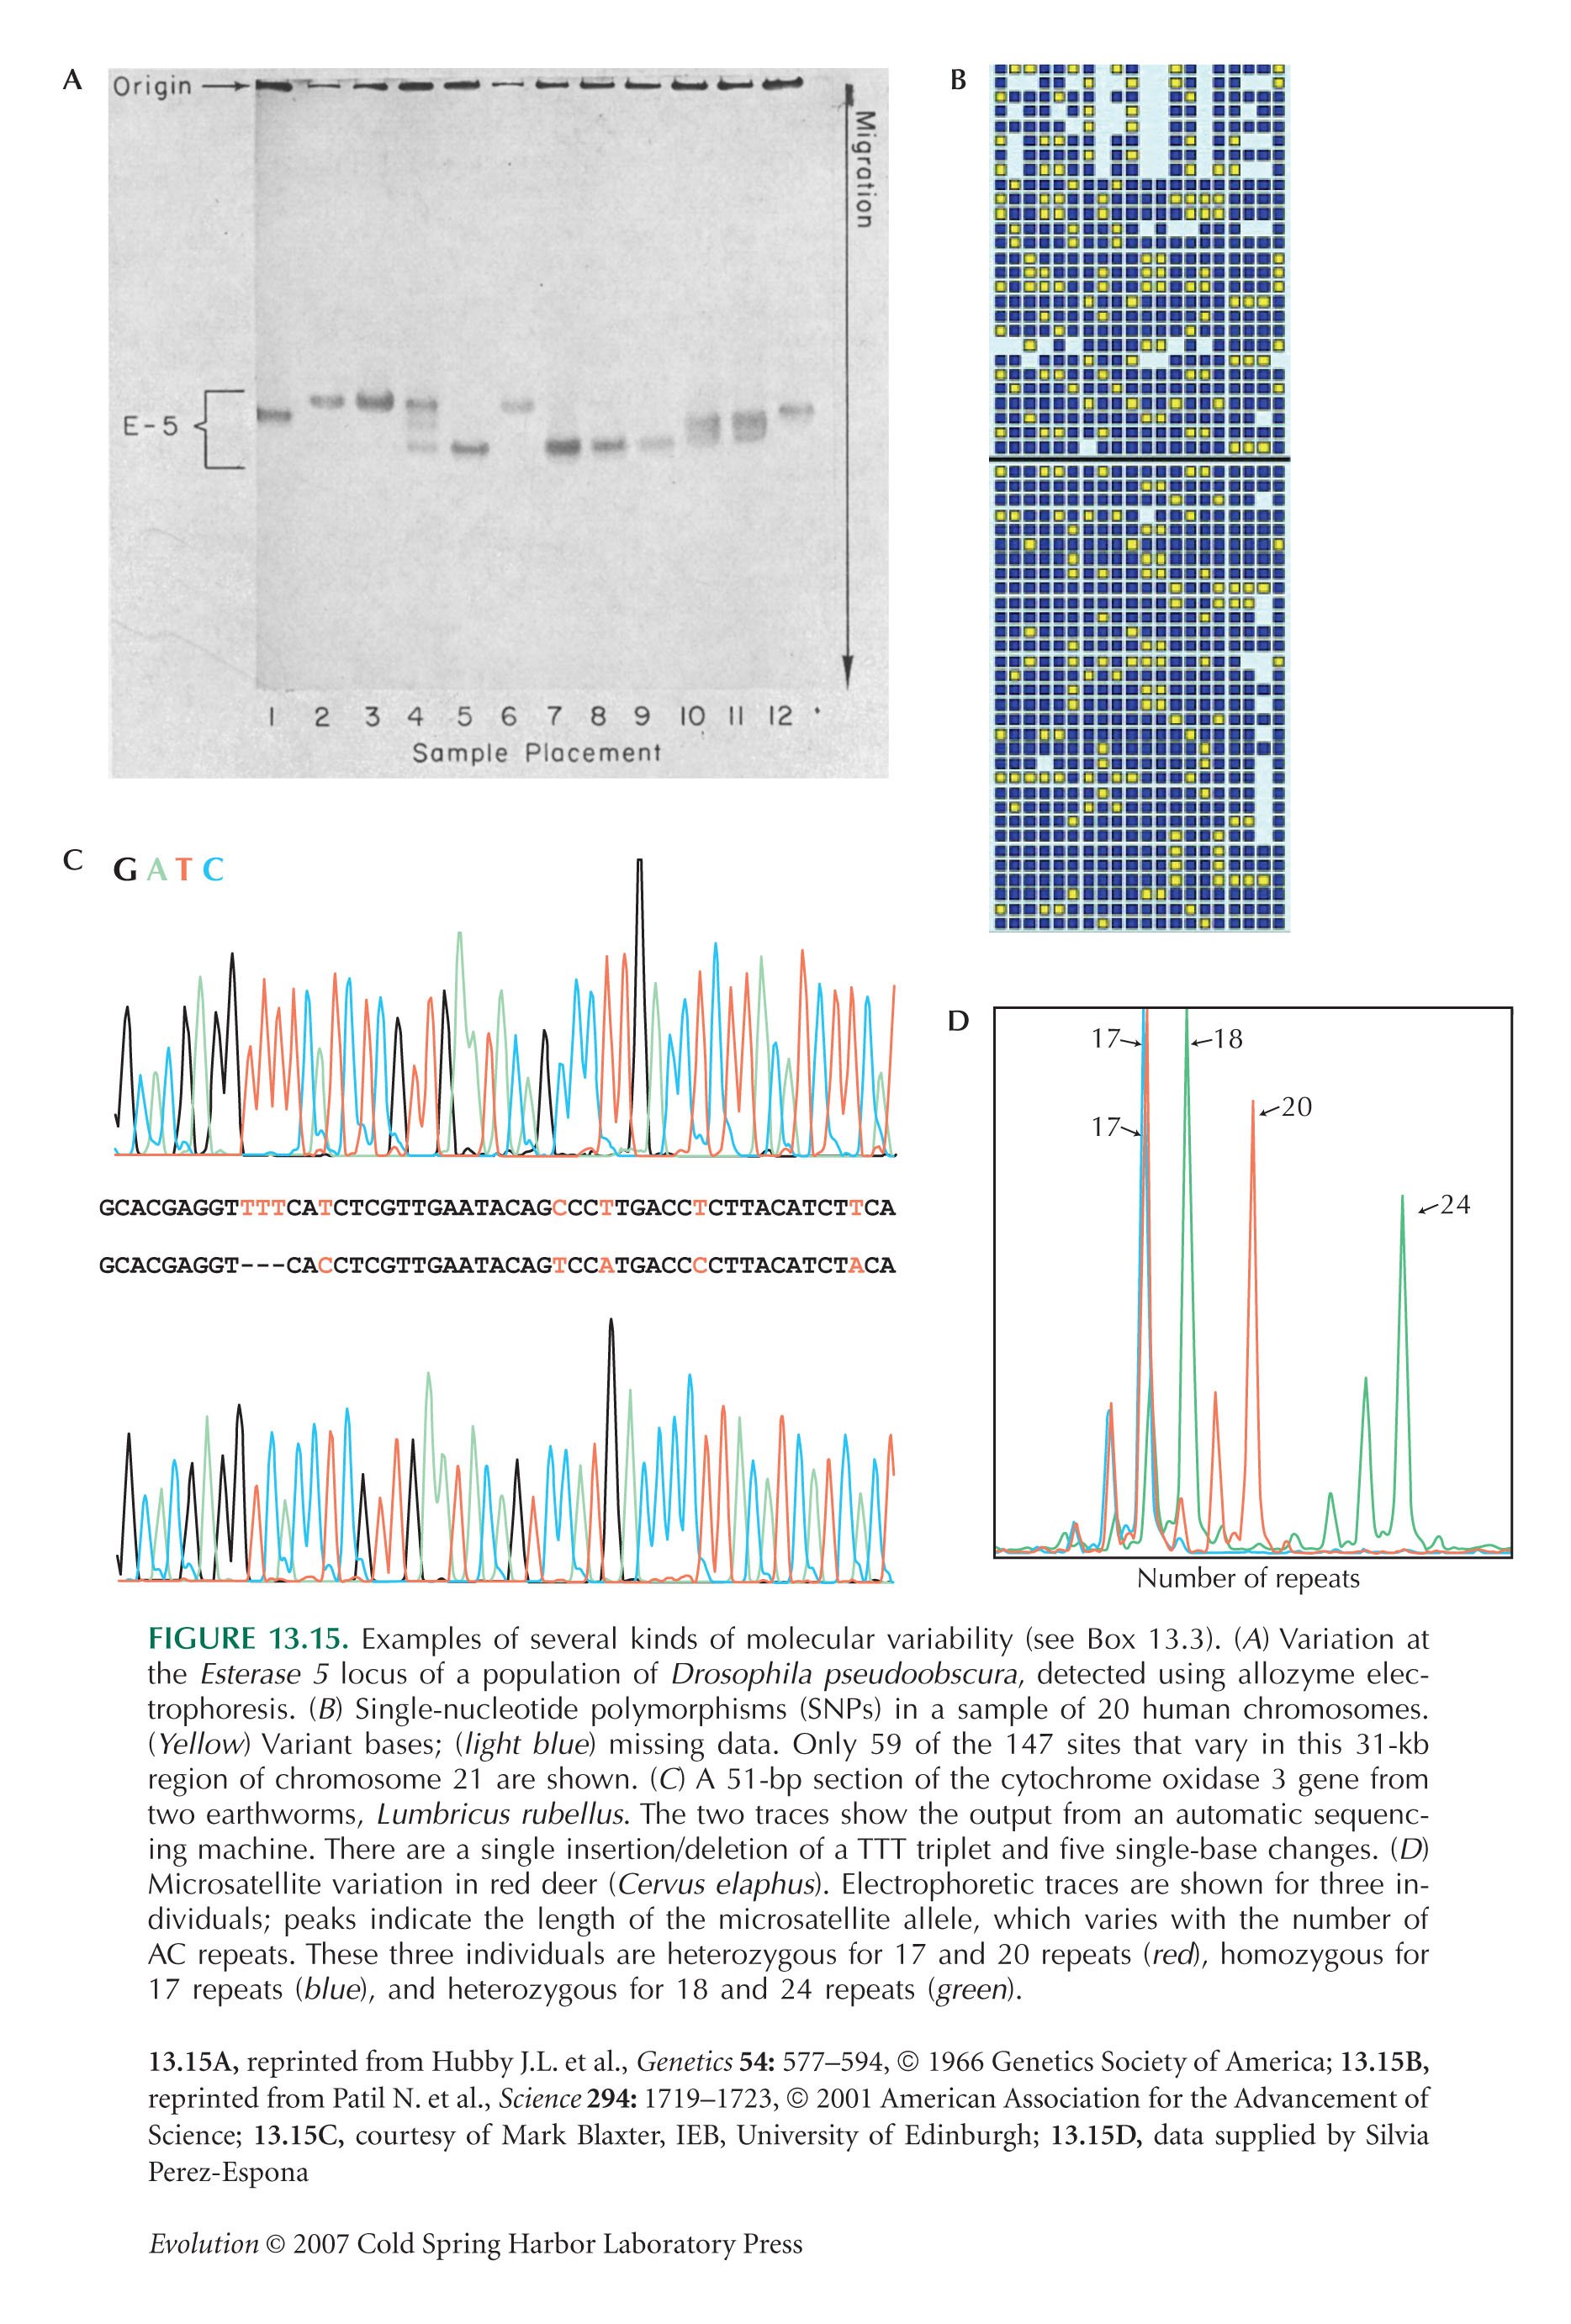
Figure 13.15A is from Lewontin and Hubby (1966). Figure 13.15B is from Patil et al. (2001).
Data on electrophoretic diversity in Figure 13.16 are from Nevo et al. (1984).
Estimates of genetic diversity in Escherichia coli are from Selander and Levin (1980) based on 20 genes; these estimates are higher than those of Milkman (1973).
We will see in Chapter 16 that the ratio between the genetic diversity within populations and the diversity within the species as a whole is 1 – FST. This is typically 10–20%, so that the bulk of variation is held within local populations (see pp. 446–448).
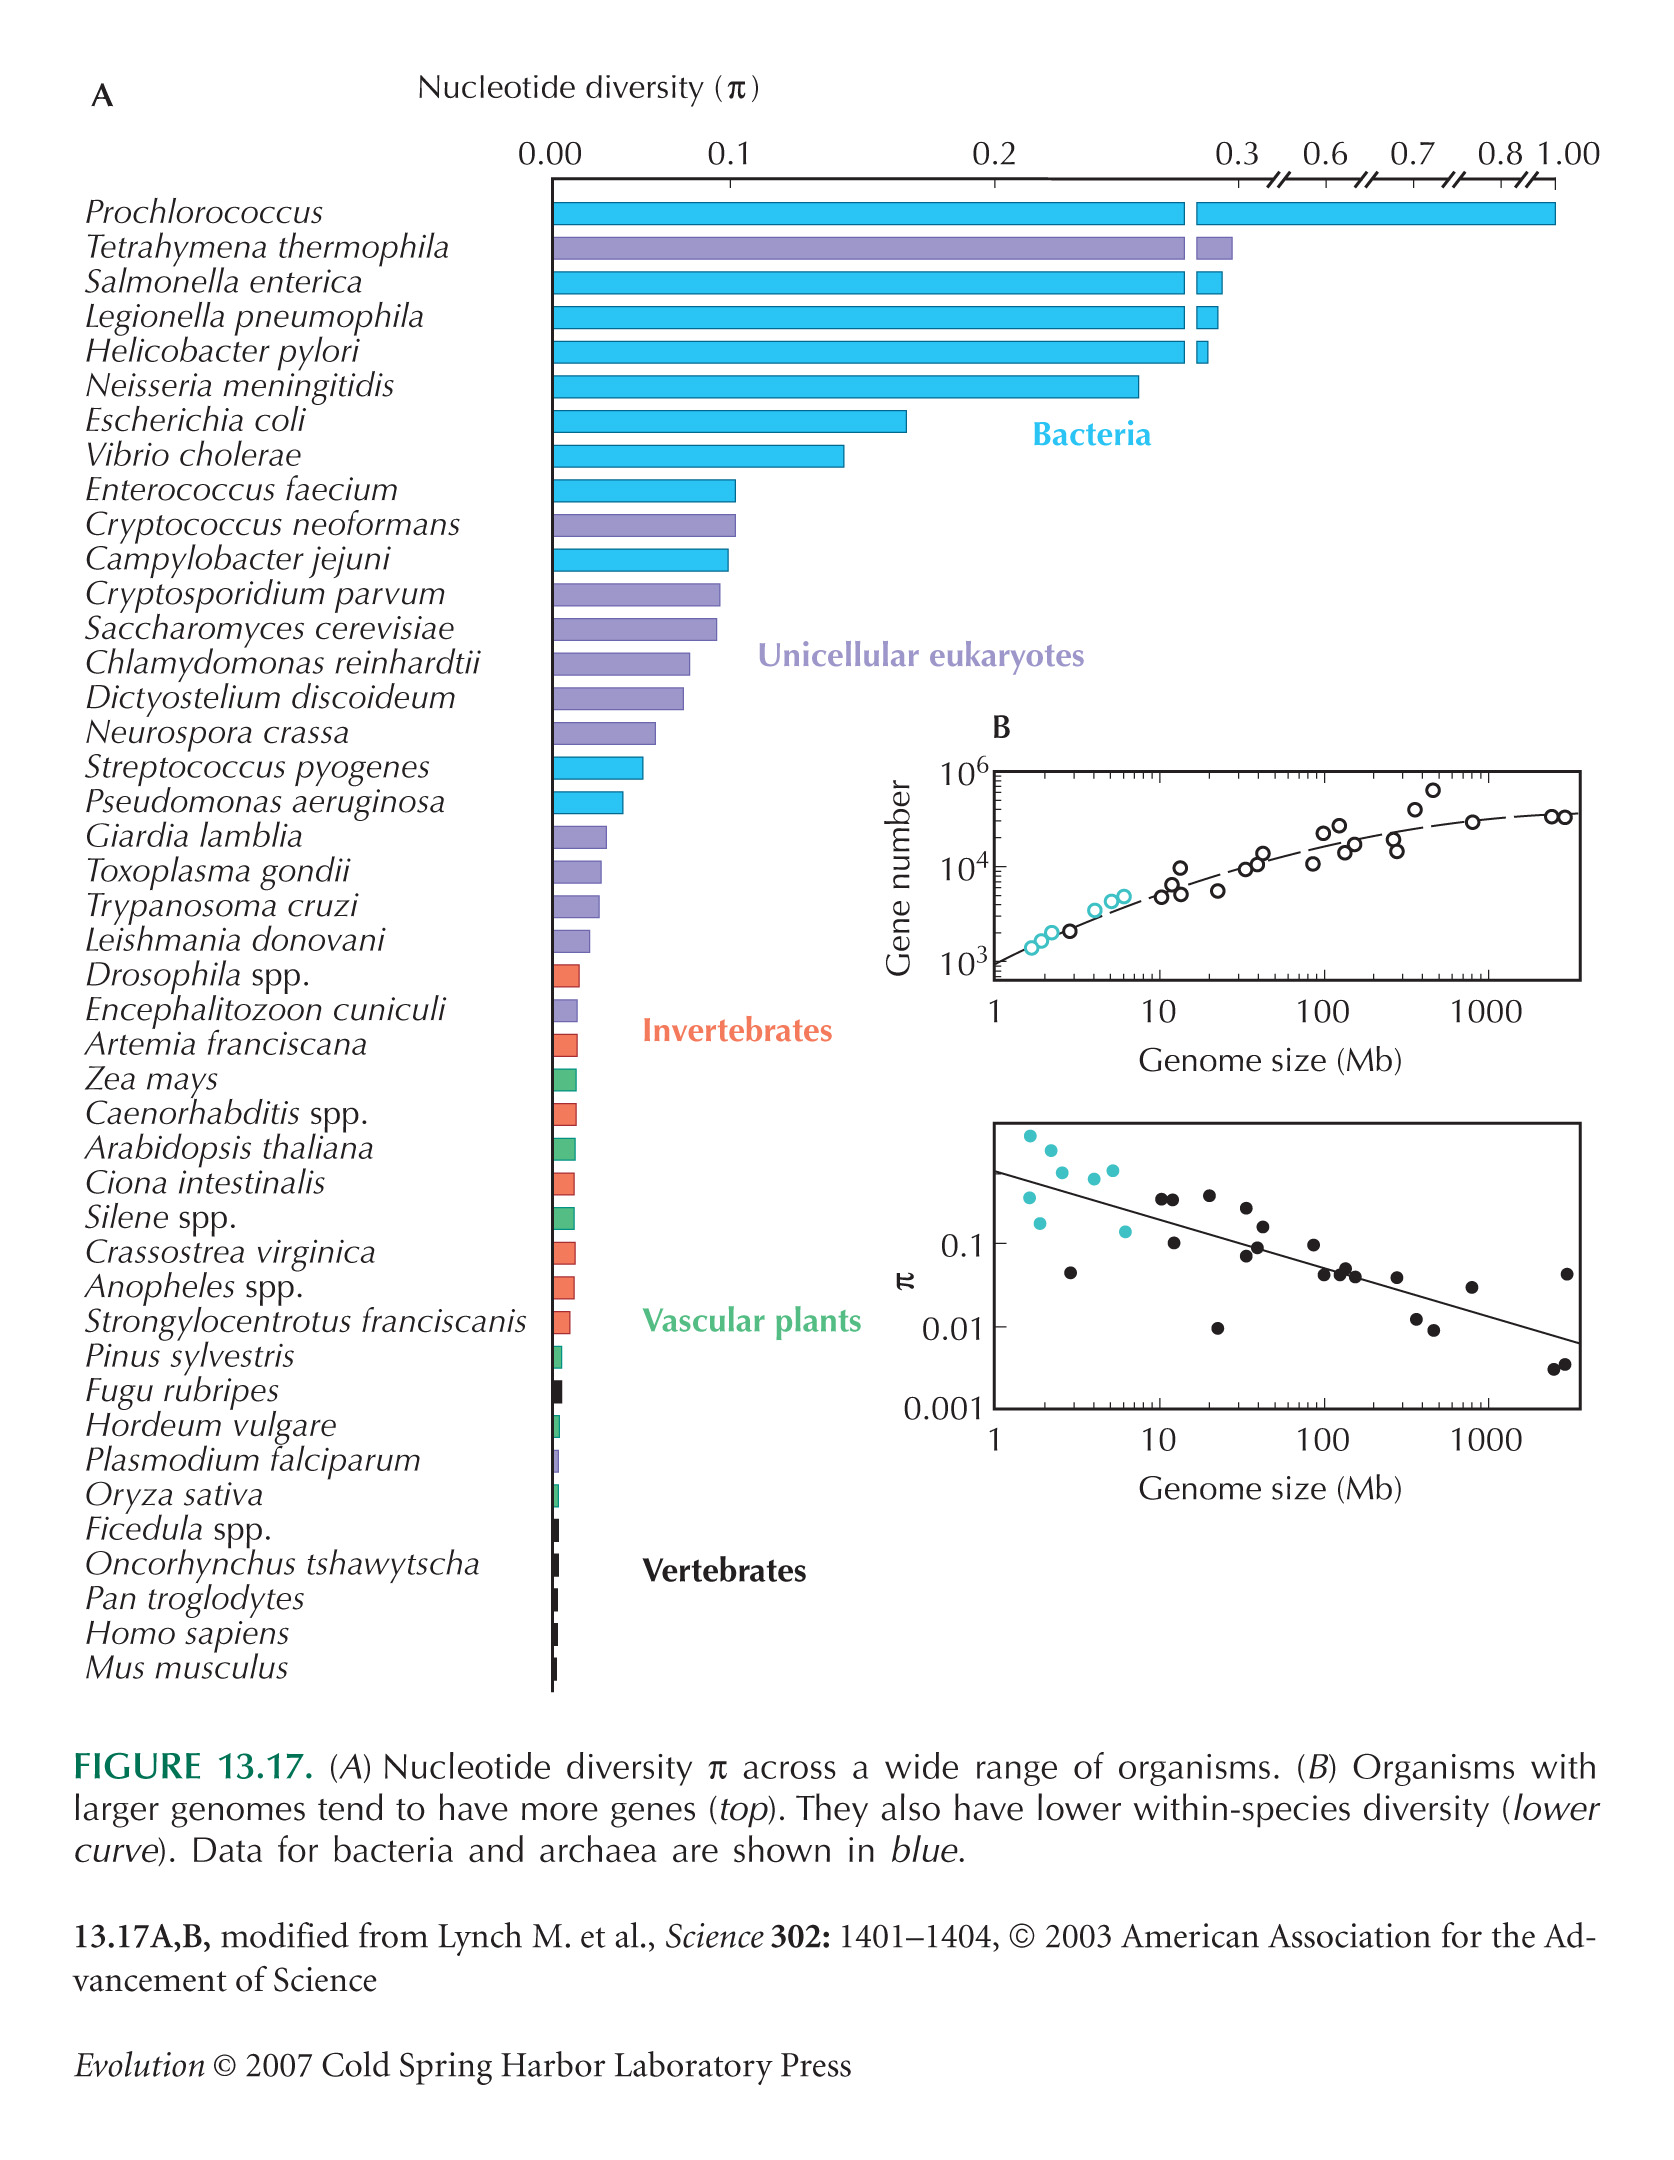
The survey of nucleotide diversity (see Fig. 13.17) is from Lynch and Conery (2003, Fig. 1). These authors present values as estimates of Neµ, assuming that the neutral theory correctly predicts that π = 4Neµ/(1 + 4Neµ). However, given that selection may be acting on synonymous variation, and given that hitchhiking and population bottlenecks complicate the definition of Ne (see pp. 419–420), these values are best seen as primarily describing the level of nucleotide diversity.
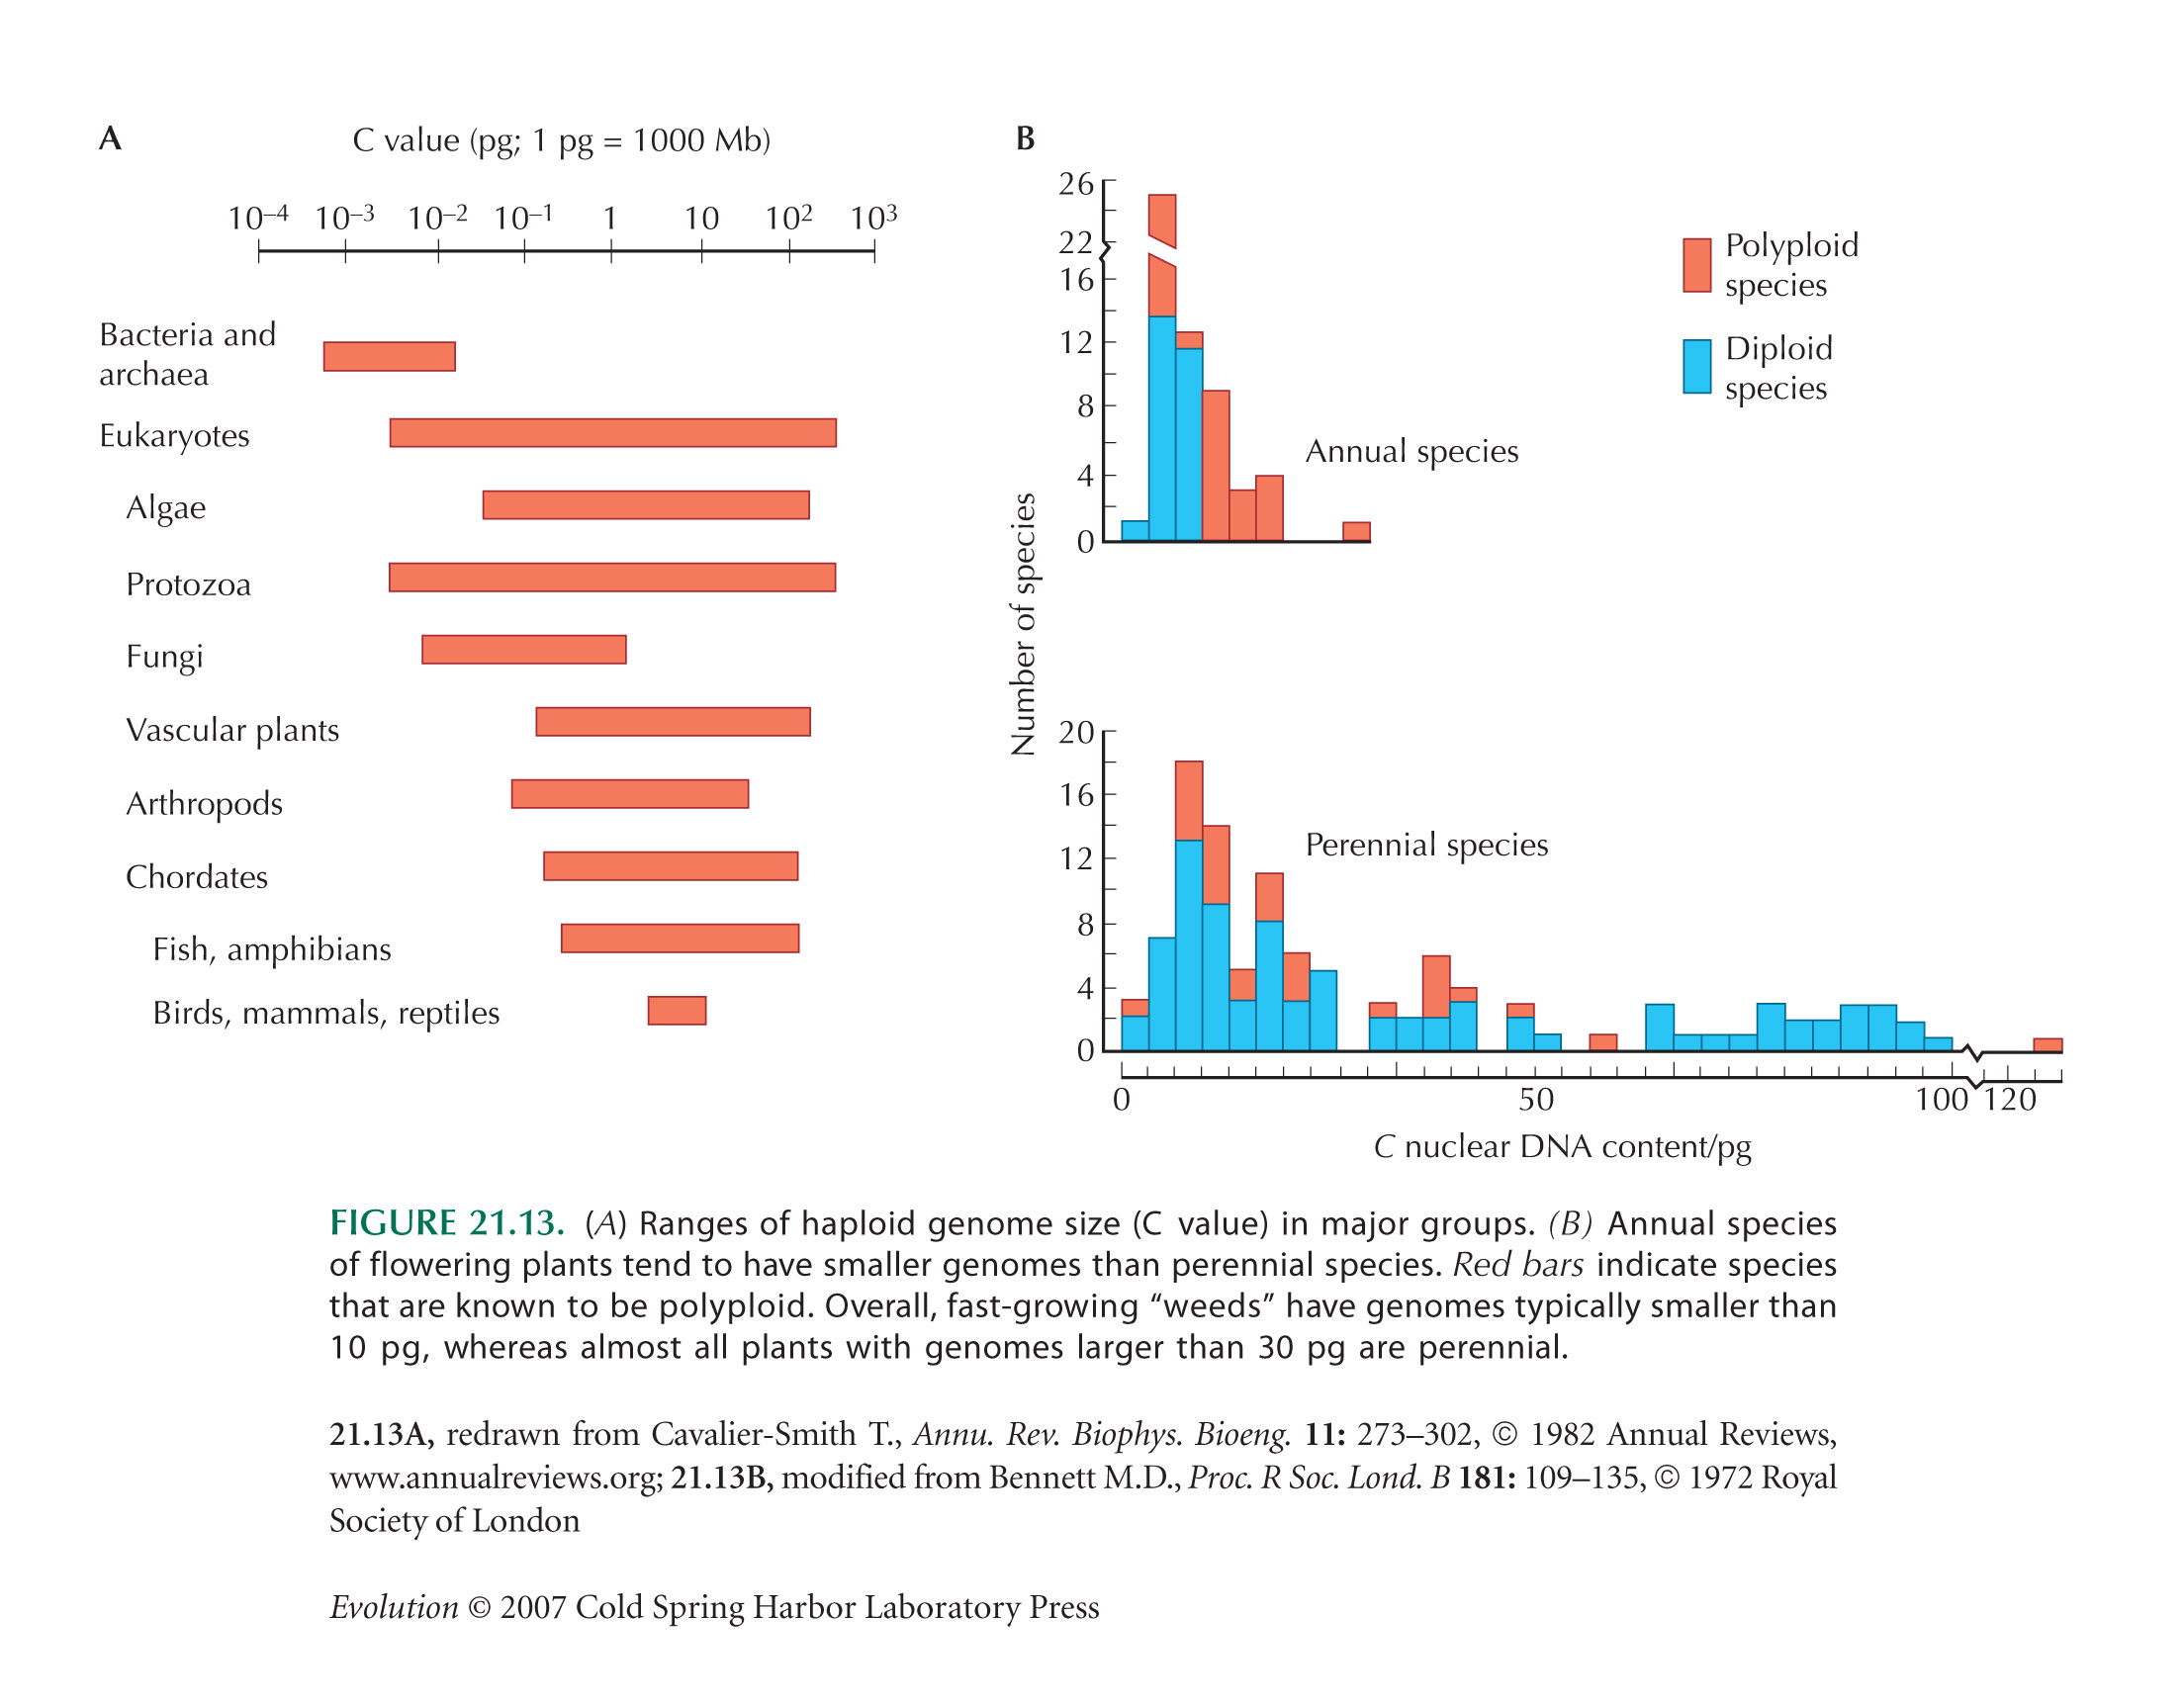
Lynch and Conery (see Fig. 13.17B) show a smooth increase in gene number with genome size. However, this is biased, because it includes only genomes with complete sequence, which are chosen to be small. Genome sizes, in fact, vary enormously across organisms with similar gene number (see Figs. 7.1 and 21.13).
Genetic Variation Is Greater in More Numerous Species, but the Relationship Is Weak
Diversity in elephant seals (see Fig. 13.18) is described by Bonnell and Selander (1974).
Soay sheep have been on the island of Soay since Viking times, but there may have been occasional introductions. A total of 107 sheep were transferred to the neighboring island of Hirta in 1932, and they grew to numbers peaking at 1000 or so. Bancroft et al. (1995) argue that the founding population from Soay is unlikely to have been extremely variable, so that variation must have been largely preserved during the past 70 years, despite the small population on Hirta. However, the variance of genetic diversity (H) across loci is high, which suggests that some of the diversity may have been due to the introgression of alleles at some loci.
Figure 13.20 is from Gillespie (1991, Fig. 1.17), based on data from Nei and Graur (1984).
Allozyme diversity in the Hawaiian Drosophila is reviewed by DeSalle and Grimaldi (1991).
Small et al. (2007) report extremely high levels of DNA sequence diversity in sea squirts, which is consistent with their very high effective population.
Bazin et al. (2006) review nuclear and mtDNA diversity across approximately 3000 animal species. They find that although diversity in the nuclear genome does increase with population size, mtDNA diversity does not. They attribute this to frequent selection sweeps in the mitochondrial genome; frequent sweeps would also explain why mtDNA often introgresses across species boundaries (Shaw 2002; Hudson and Coyne 2002). However, see Mulligan et al. (2006).
Sequence with Less Function Usually Varies More
Information on diversity within species with respect to functional constraint is much sparser than data on divergence between species. This is because it takes more effort to collect multiple samples from within species than to compare two individuals from different species.
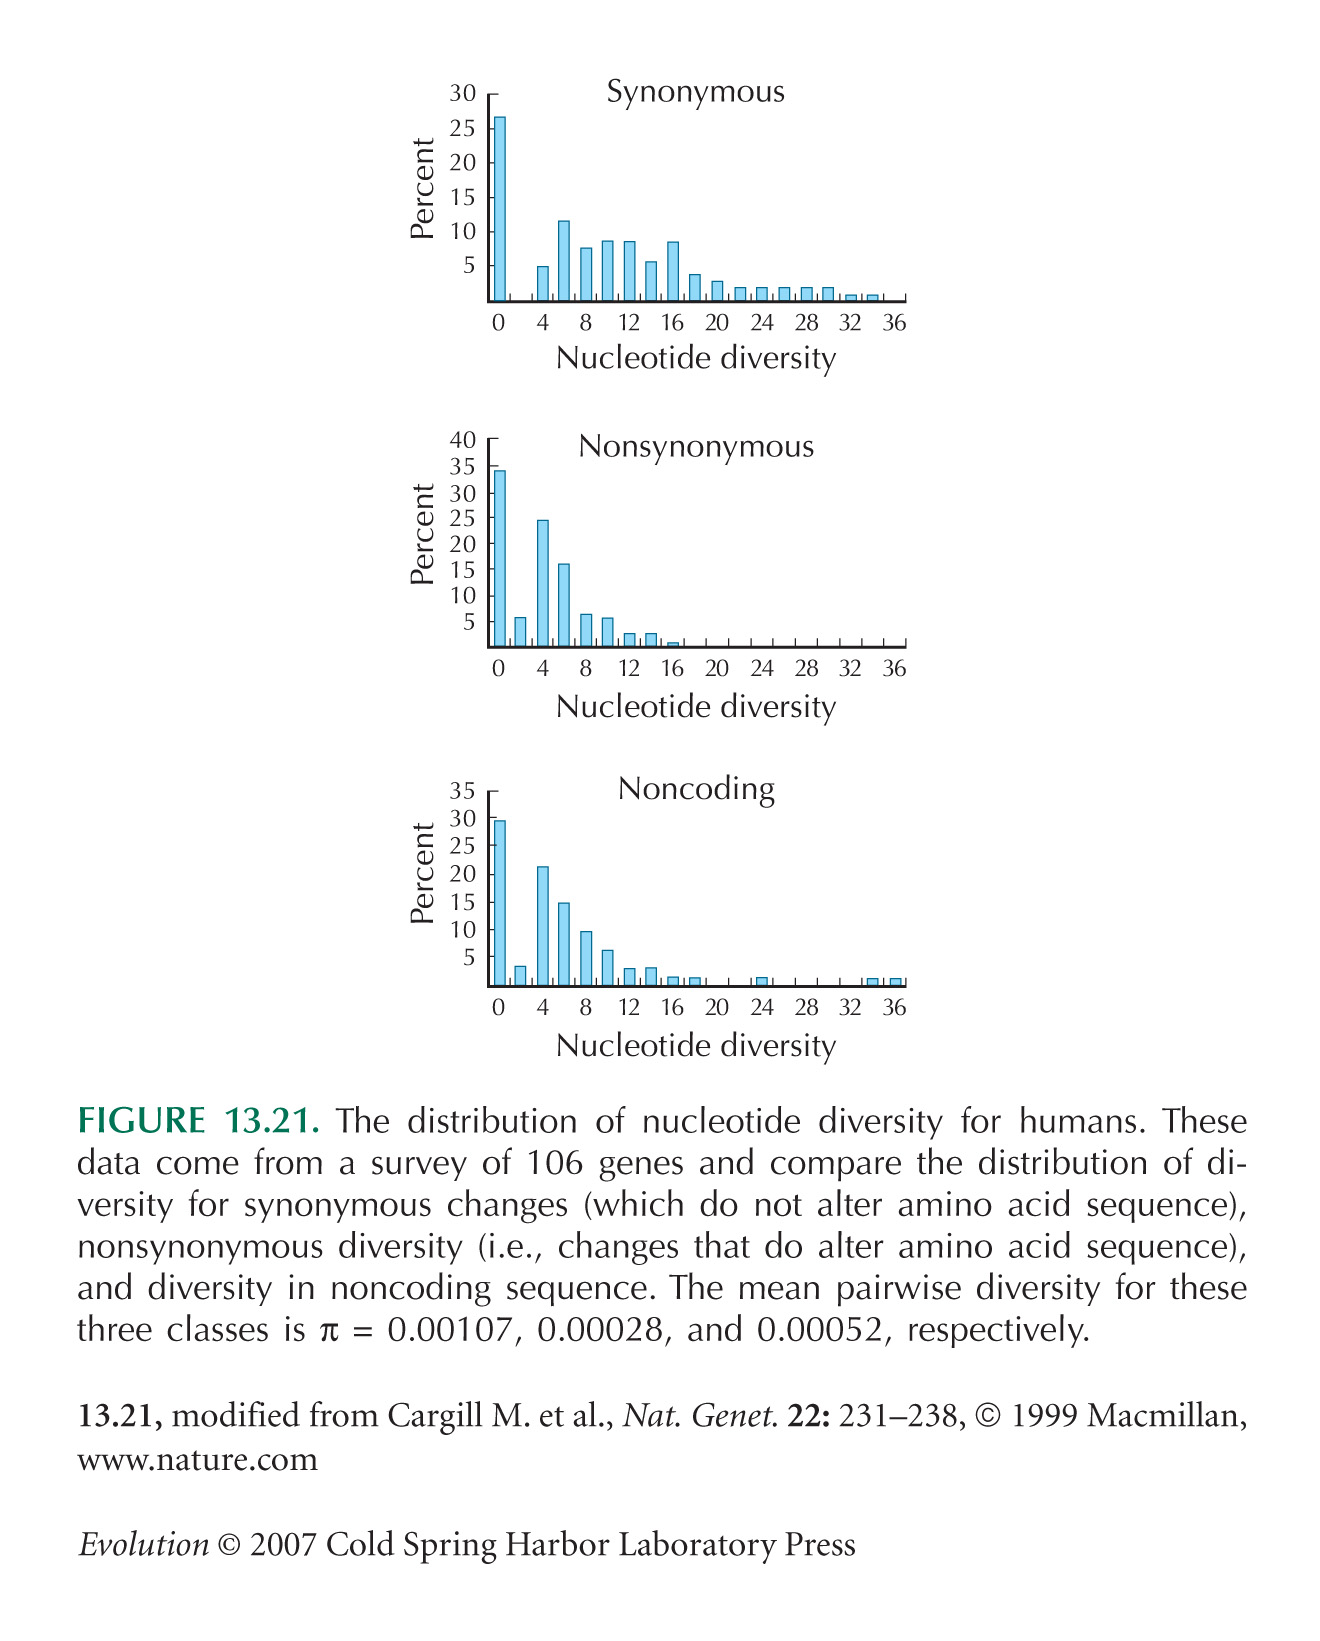
The data on human sequence variability (see Fig. 13.21) are from Cargill et al. (1999). These authors also show that there is threefold lower diversity for conservative amino acid changes, which make little chemical change, compared with nonconservative changes.
Note that values in Figure 13.21 are estimated from the number of segregating sites, rather than from pairwise diversity, on the assumption that the neutral theory holds (see pp. 533–535). However, these two ways of estimating diversity give very similar values for these data.
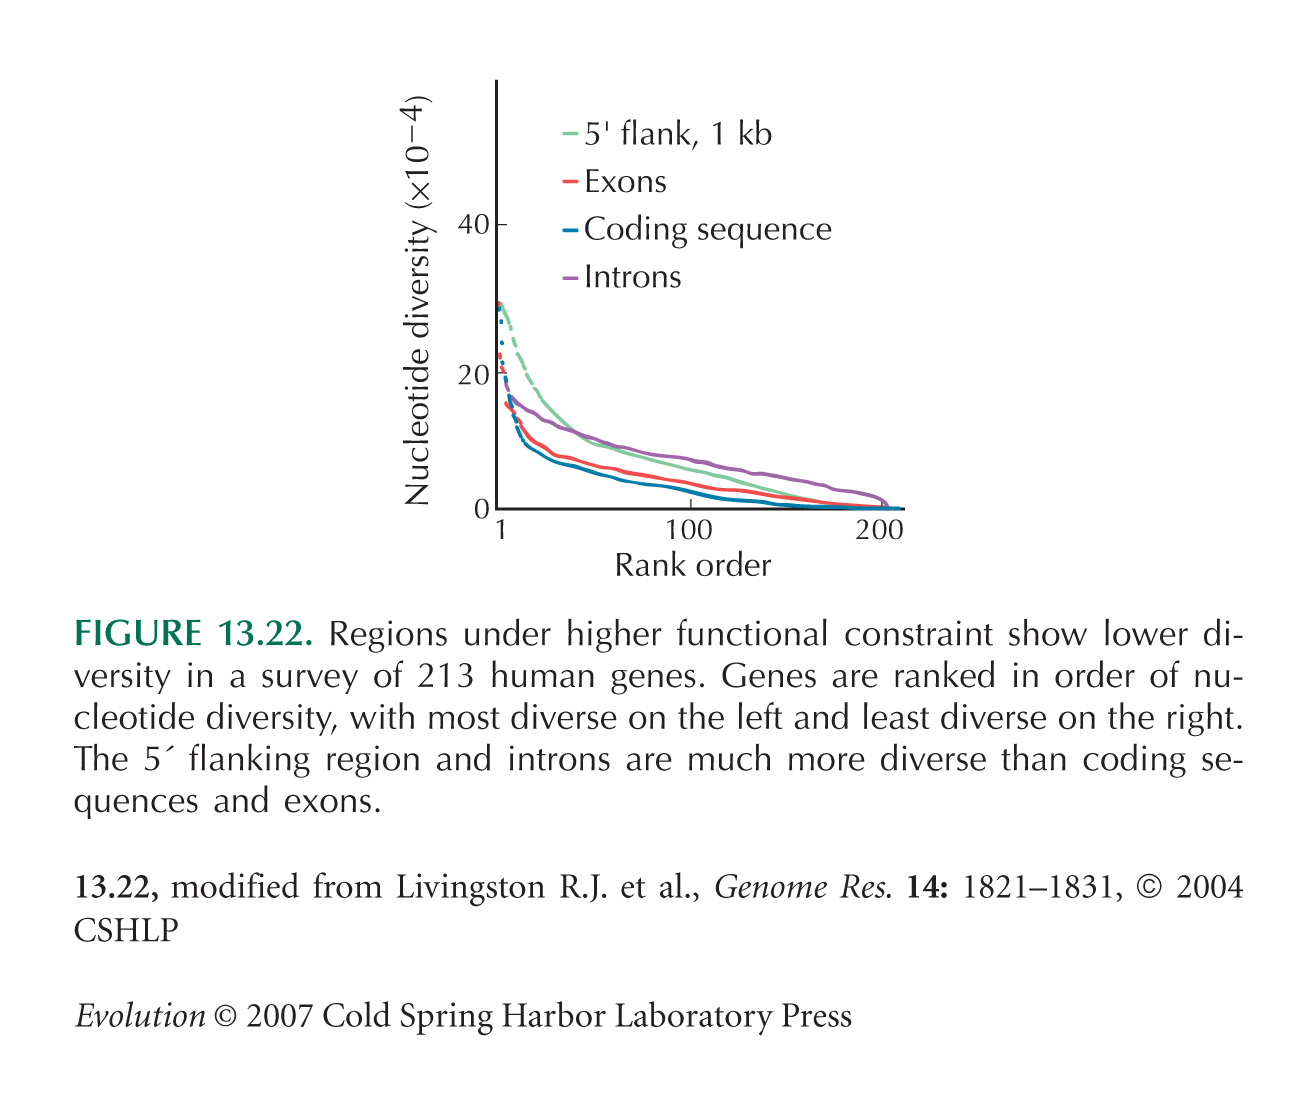
The comparison between exons, introns, and flanking regions (see Fig. 13.22) is from Livingston et al. (2004).
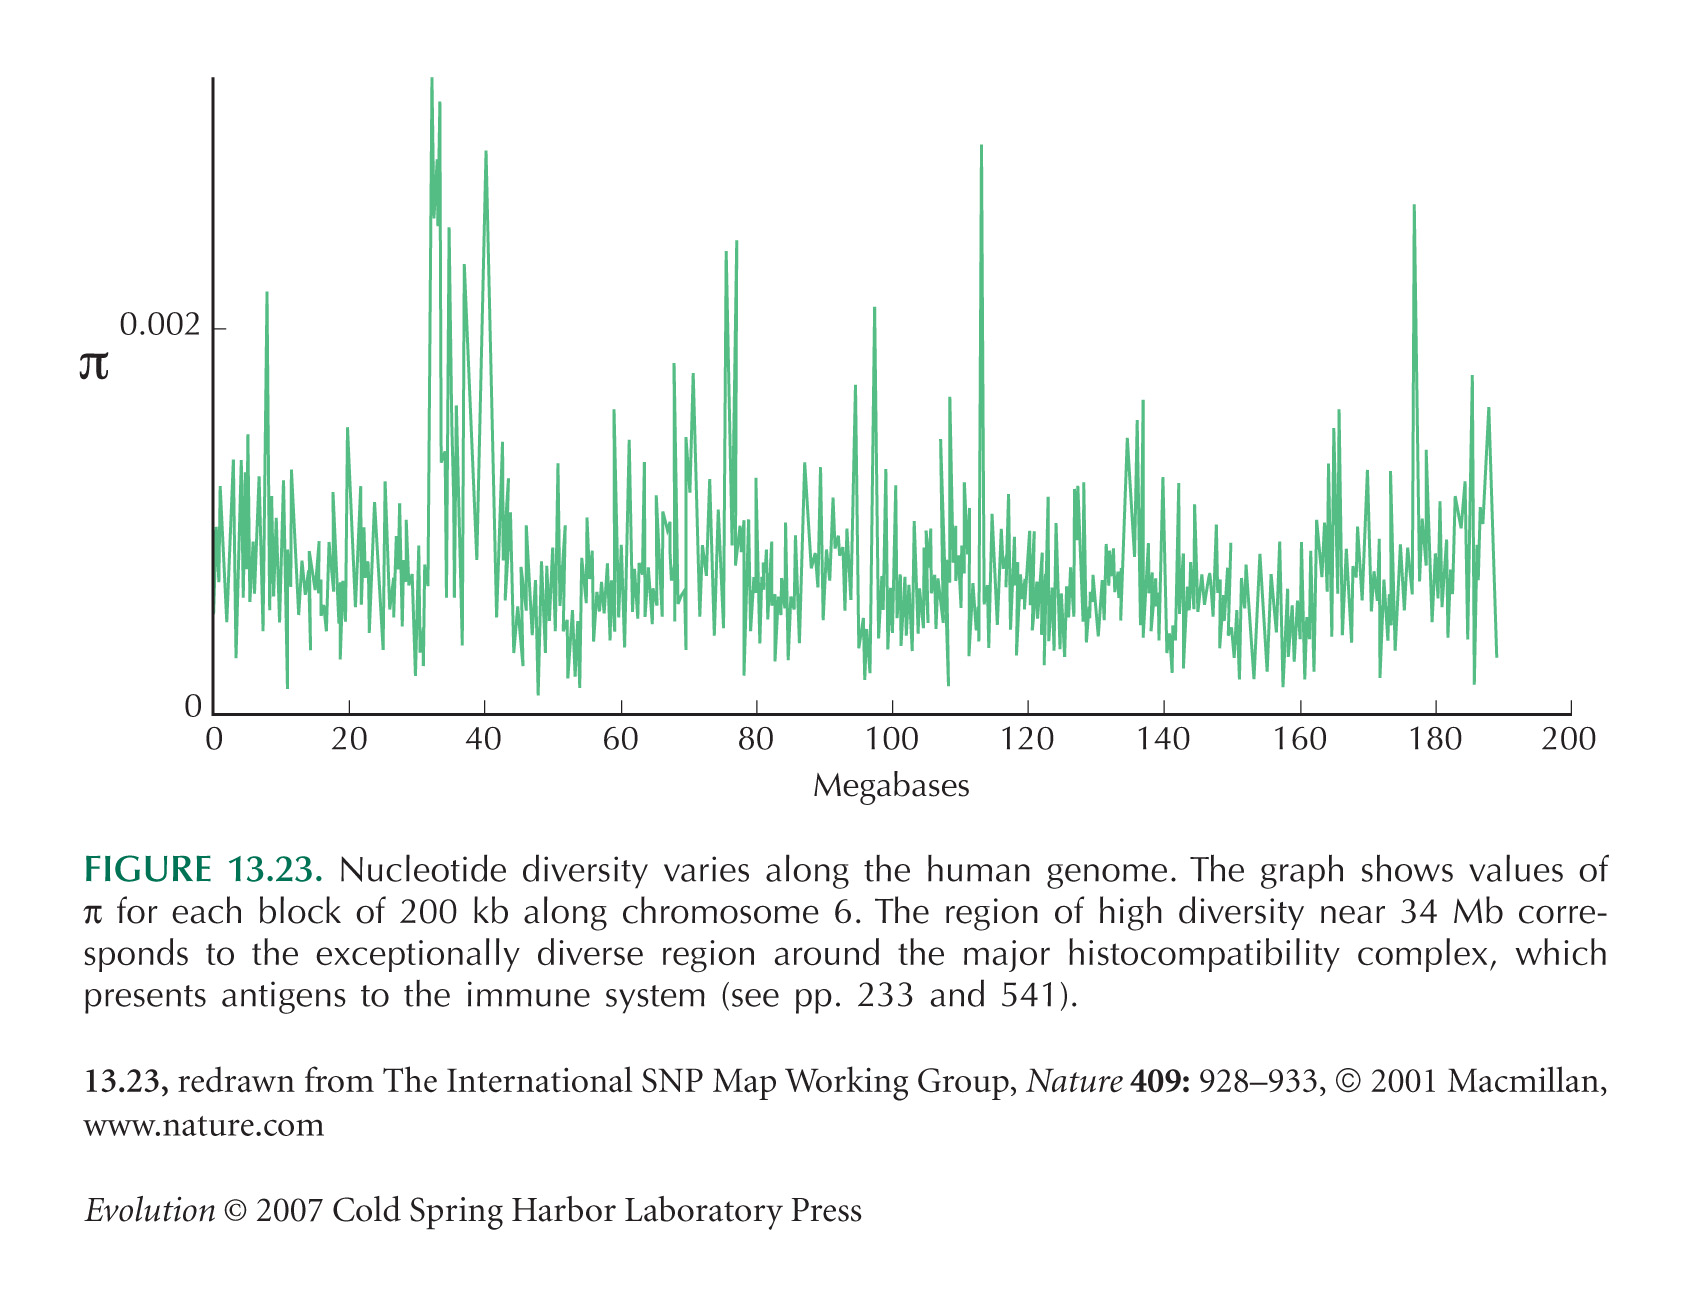
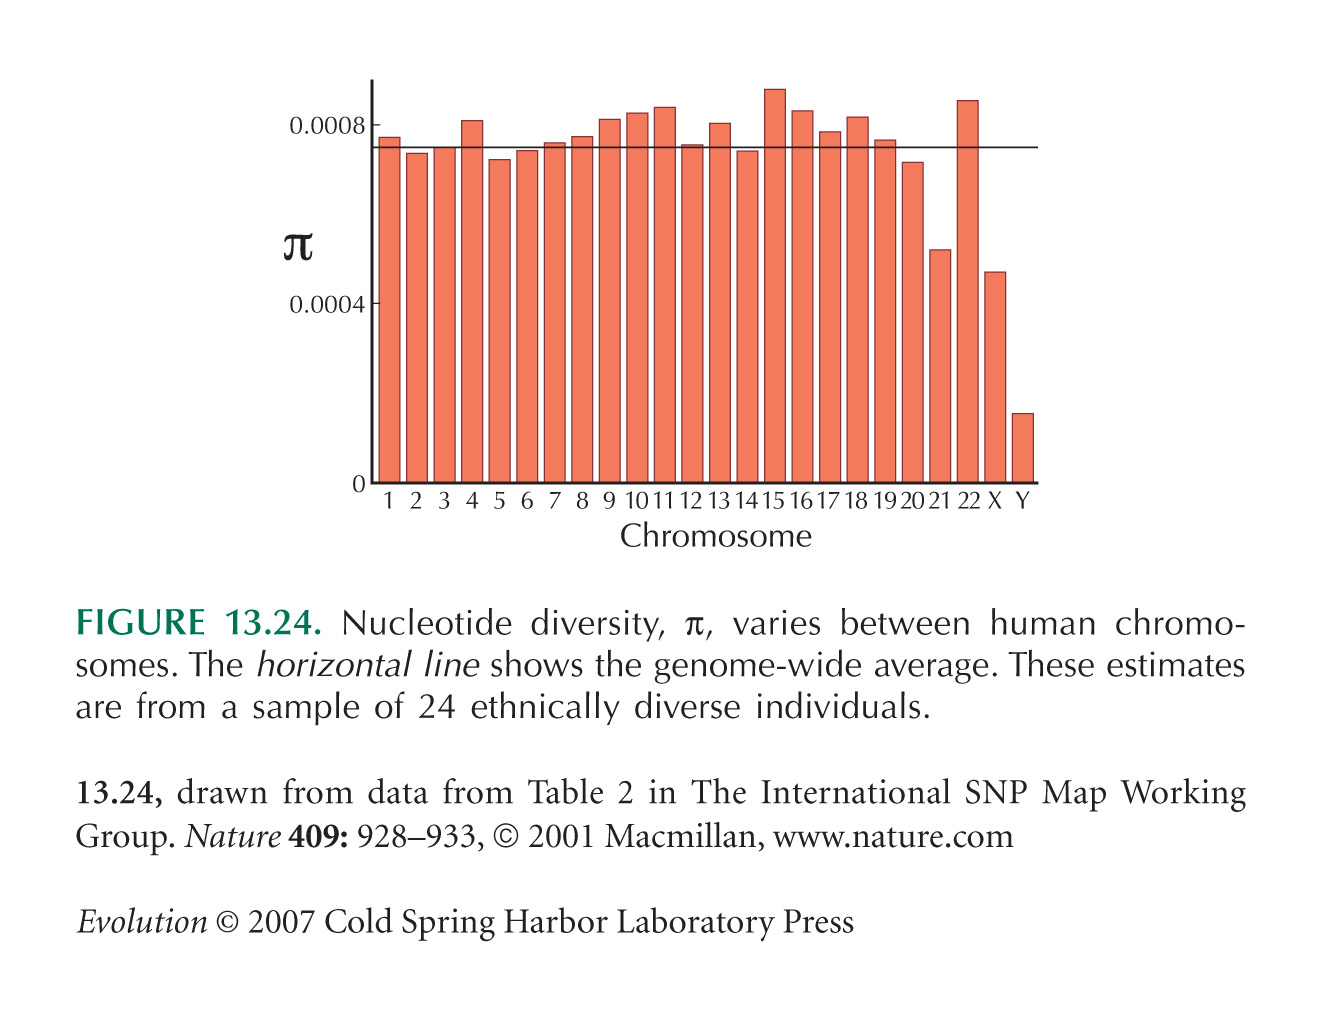
Figures 13.23 and 13.24, which show how SNP diversity varies along the genome, are from Sachidanandam et al. (2001).
Differences between Species Accumulate Steadily: The Molecular Clock
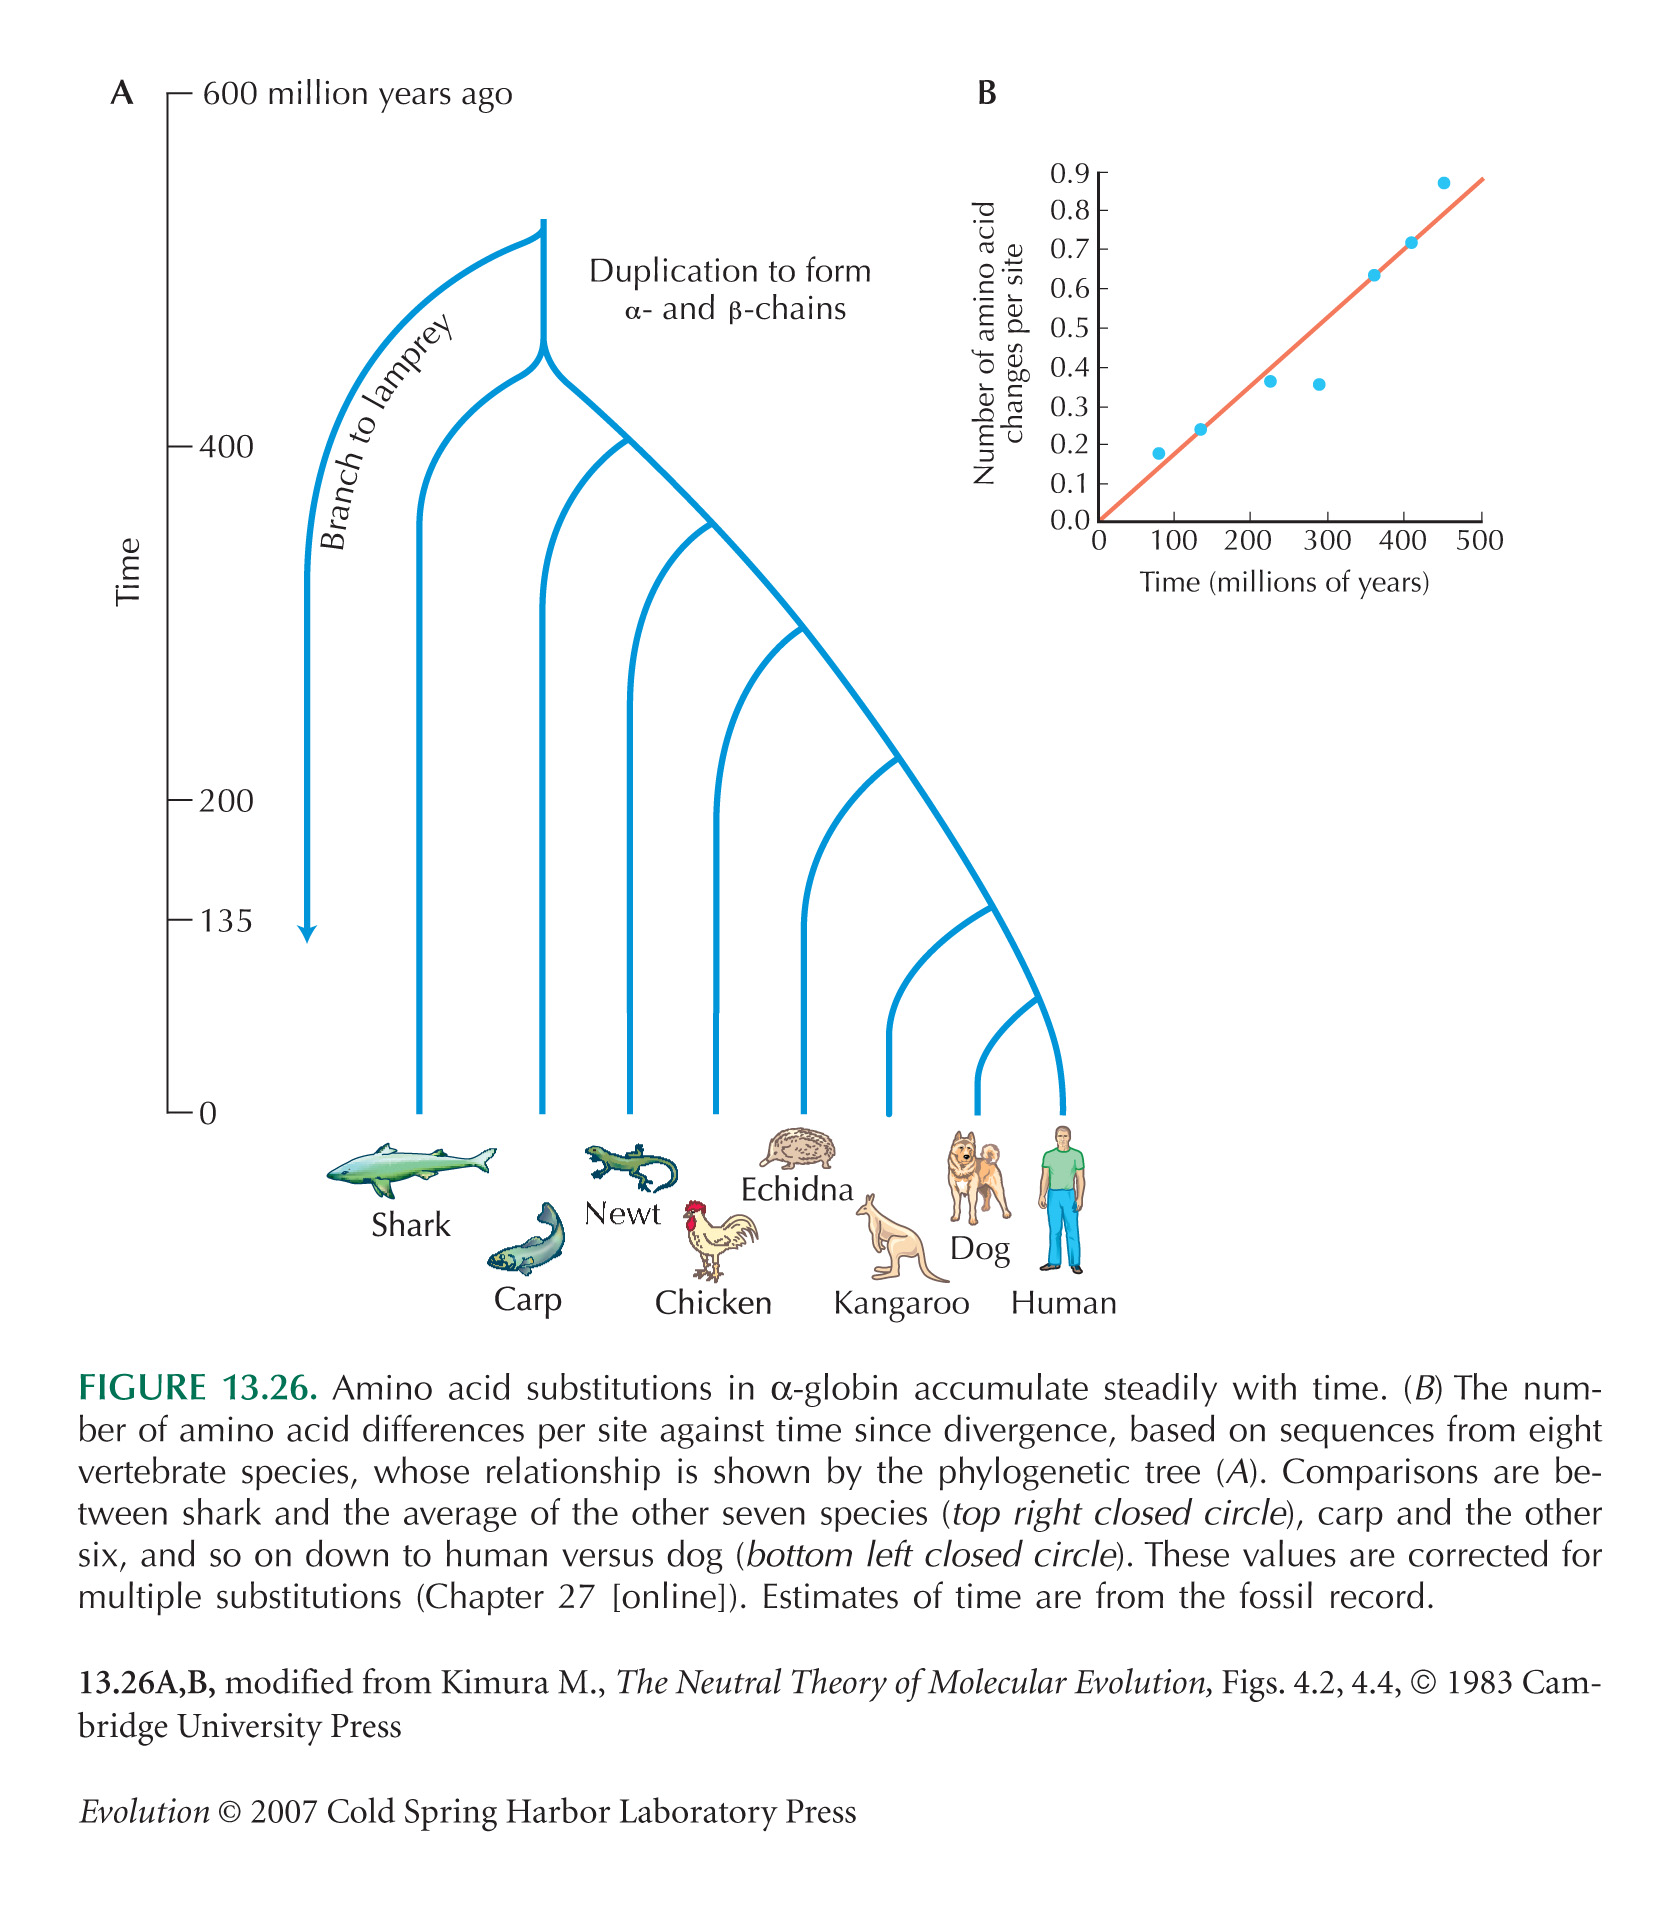
The rate of 1.2 × 10⁻⁹ for α globin, across diverse vertebrate lineages, is from Kimura (1983, Fig. 4.2).
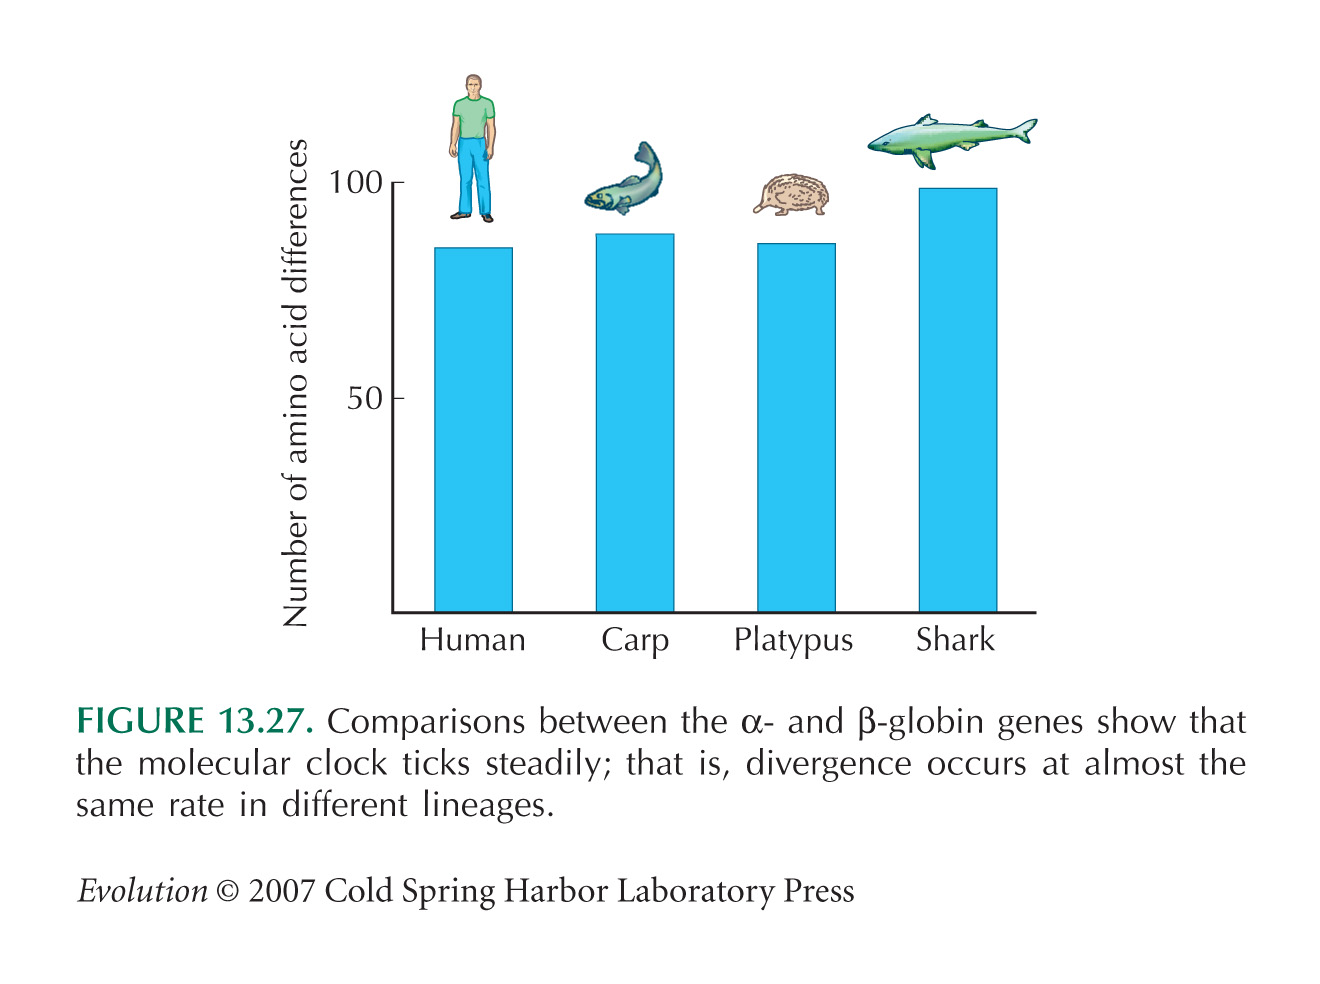
Data on divergence between α and β globins (see Figs. 13.26 and 13.27) are from Kimura (1983, Table 4.5).
The comparison between pairs of plant species of similar age is from the data of Xiang et al. (2000, Table 3). Here, excess variability is due partly to variation in when the species separated, partly to ancestral polymorphism (two lineages from within the one ancestral species will have a random coalescence time; lineage sorting), and partly to real rate differences. In their paper, Xiang et al. (2000) correct for rate variation, but these corrections are mostly not significant, and in fact, the corrected divergence times are more different than the uncorrected. (See Fig. WN13.1.)
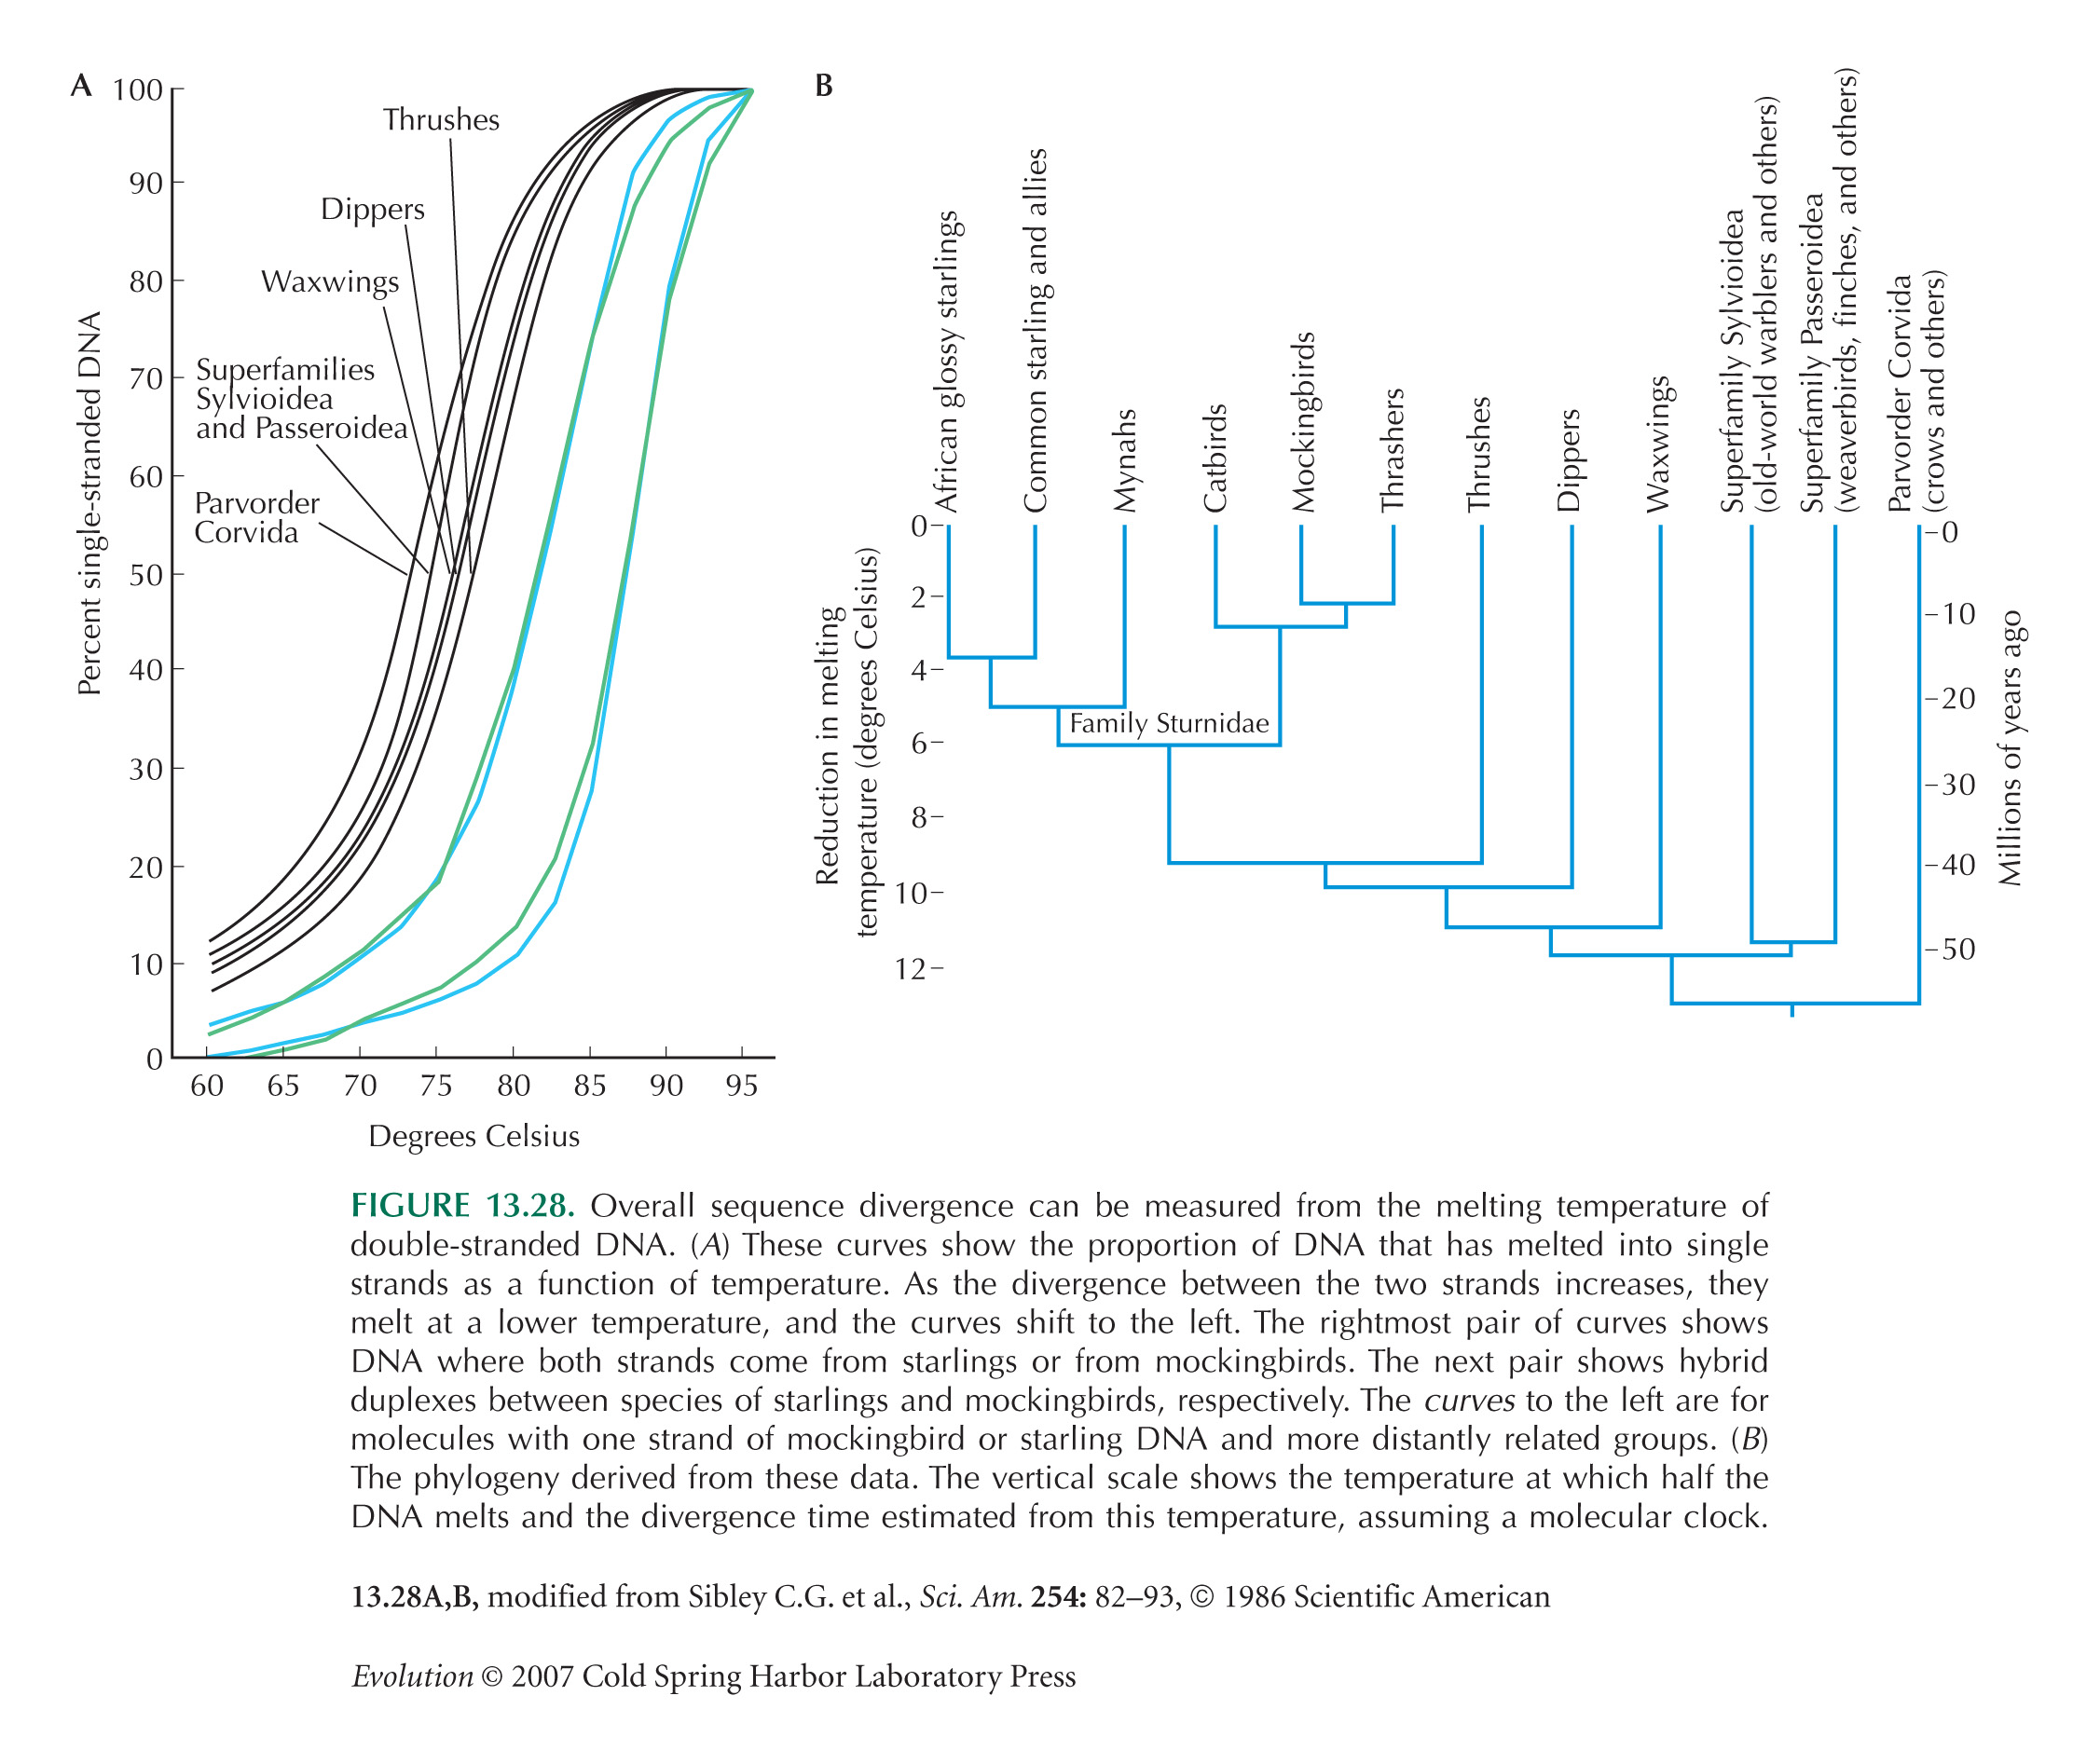
Figure 13.28, showing melting temperatures of DNA duplexes from different bird species, is from Sibley and Ahlquist (1986).
Powell et al. (1986) use Drosophila data to calibrate the rate of change in melting temperature: 1° decrease in temperature corresponds to 1.5–2% sequence divergence.
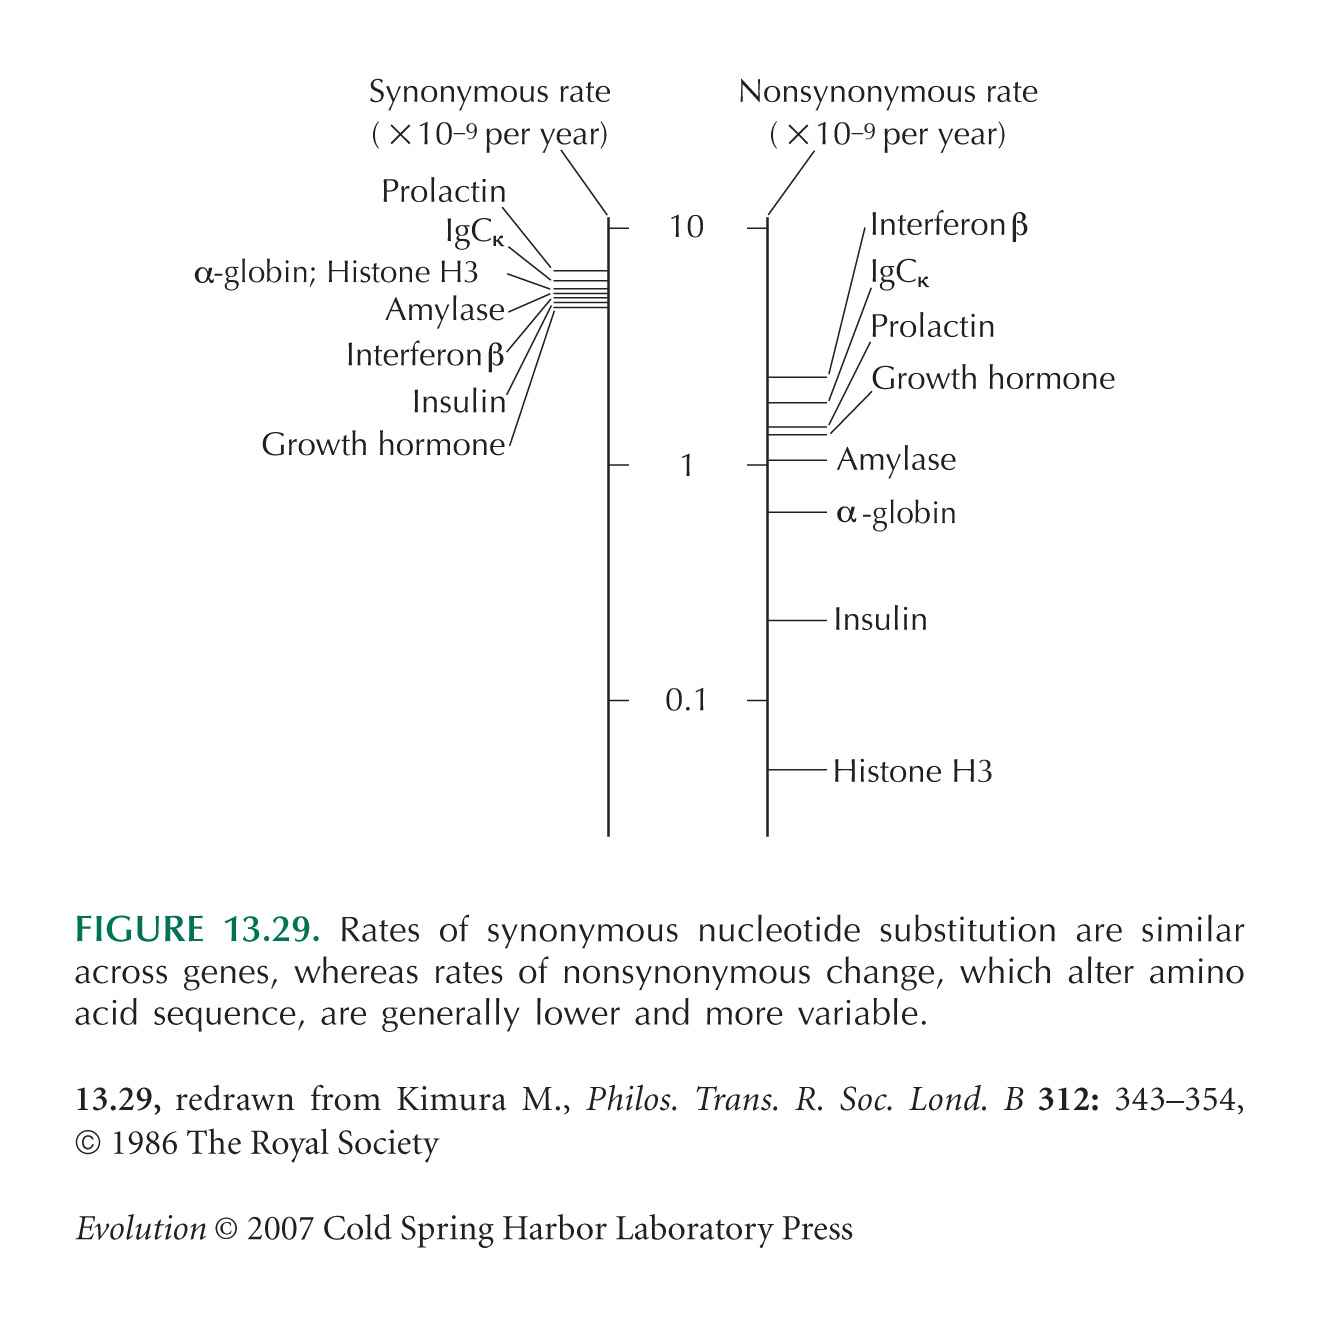
Comparisons of rates of synonymous versus nonsynonymous divergence (Fig. 13.29) are from Kimura (1986), who reviews evidence for the neutral theory.
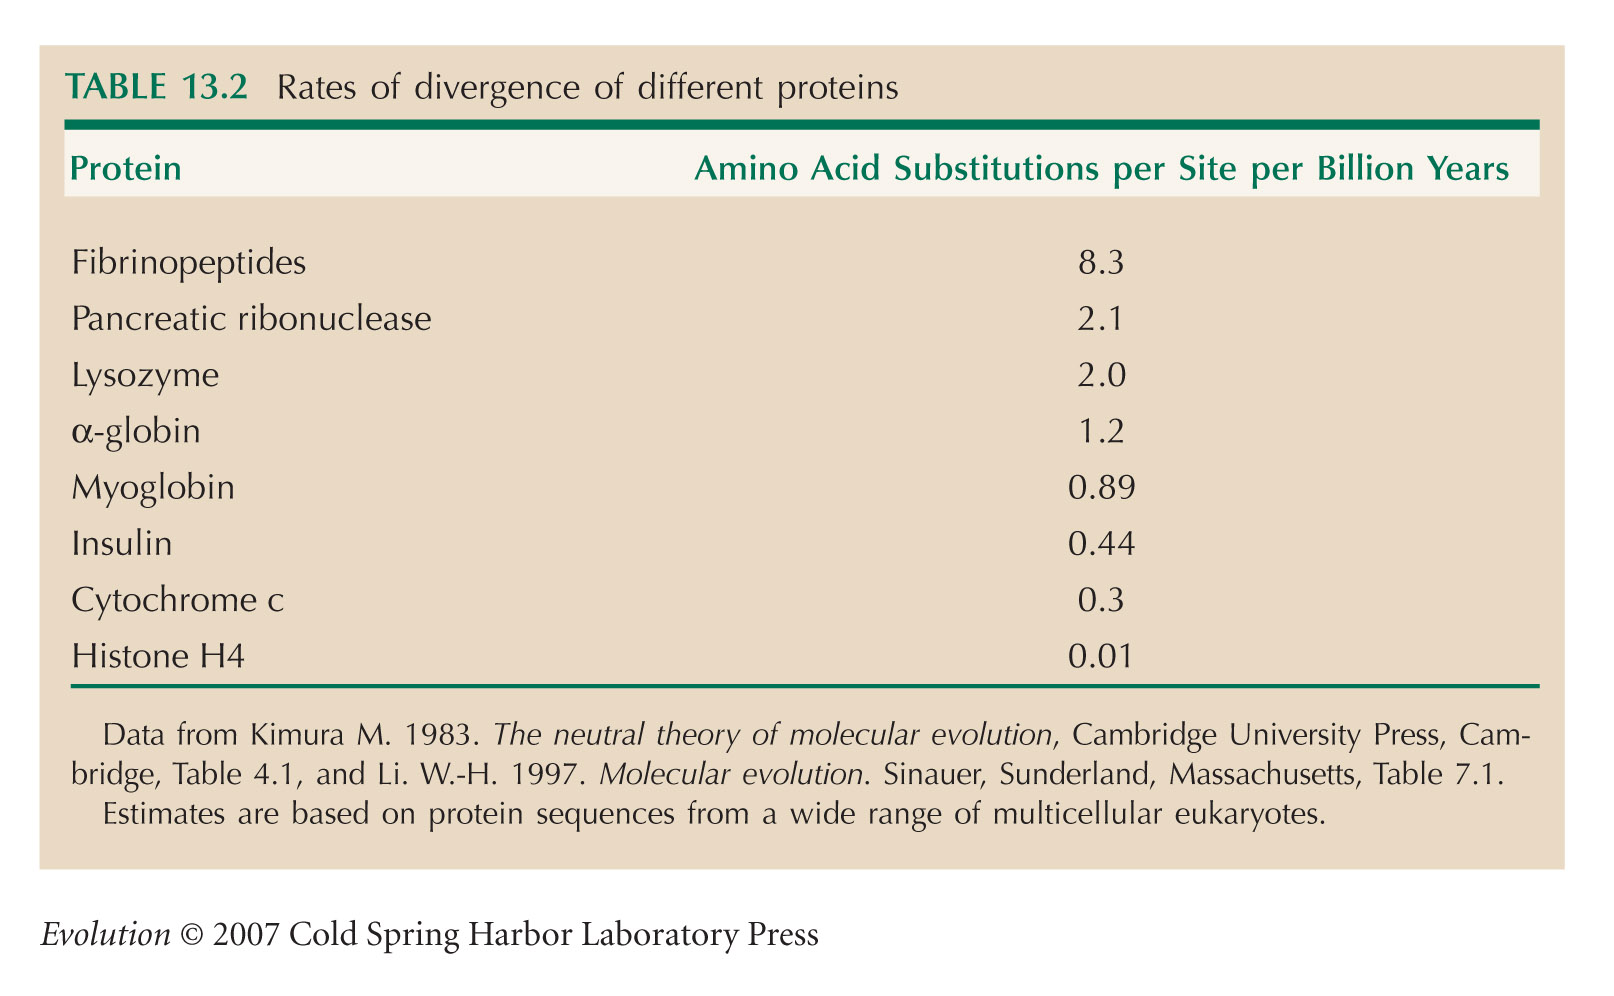
The data in Table 13.2, comparing rates of evolution of various proteins, are from Kimura (1983, Table 4.1).
Gene Arrangement Evolves More Erratically
Sebat et al. (2004) survey the frequency of small chromosomal rearrangements in humans (see Fig. 13.32). For review, see Sankoff (2003).
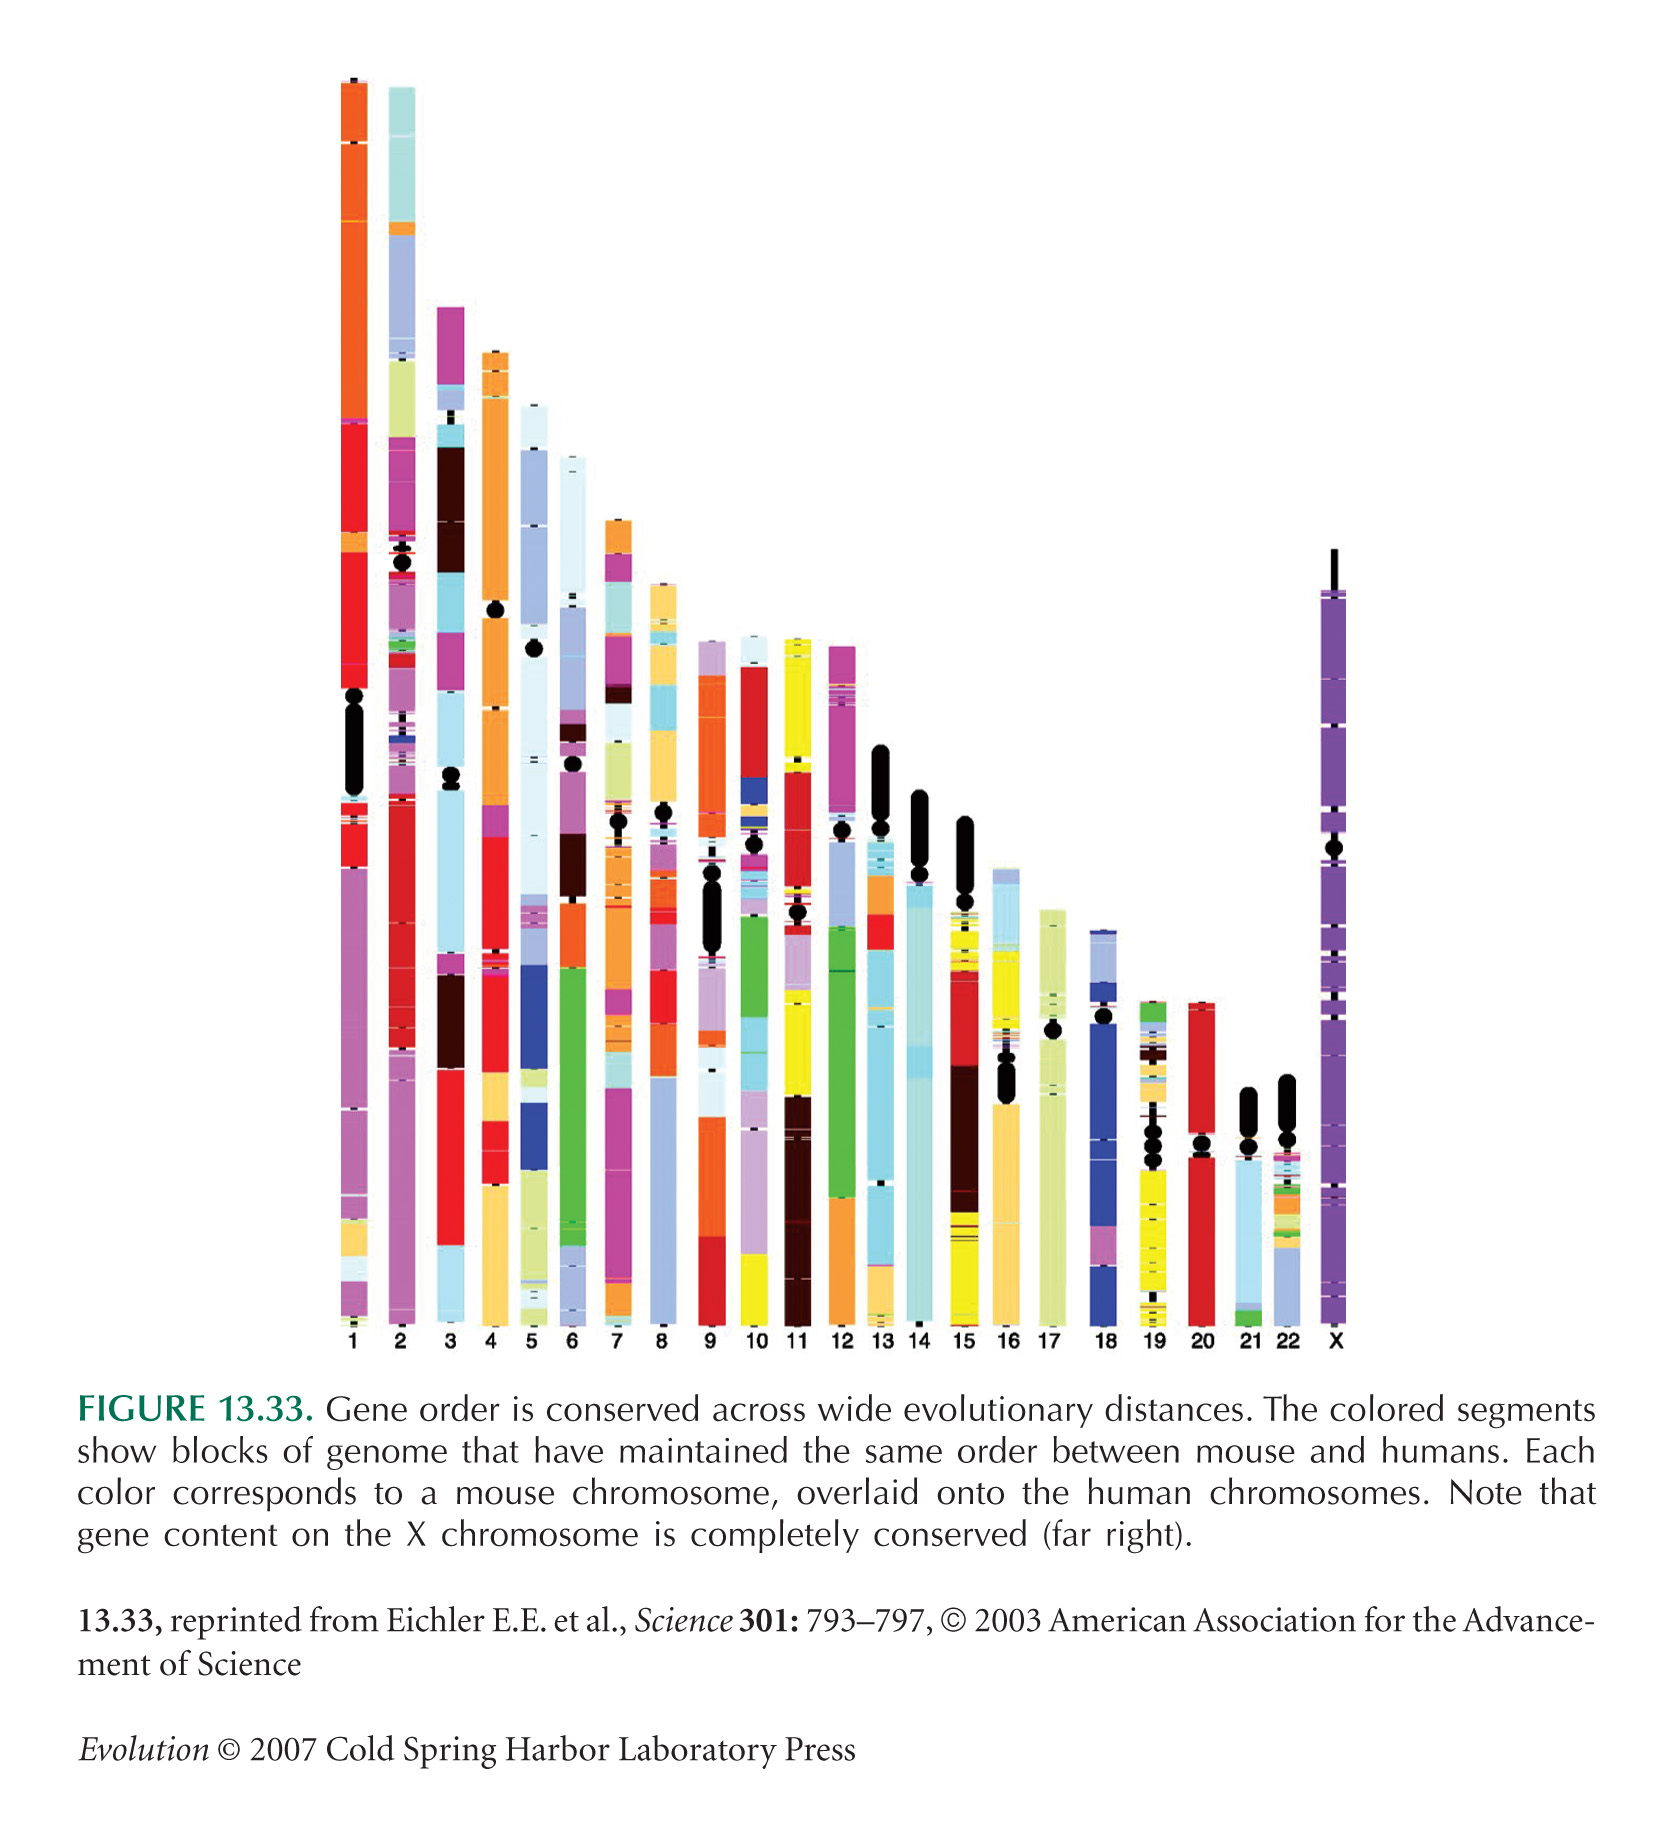
Conservation of gene order between mice and humans (Fig. 13.33) is shown by Eichler and Sankoff (2003).
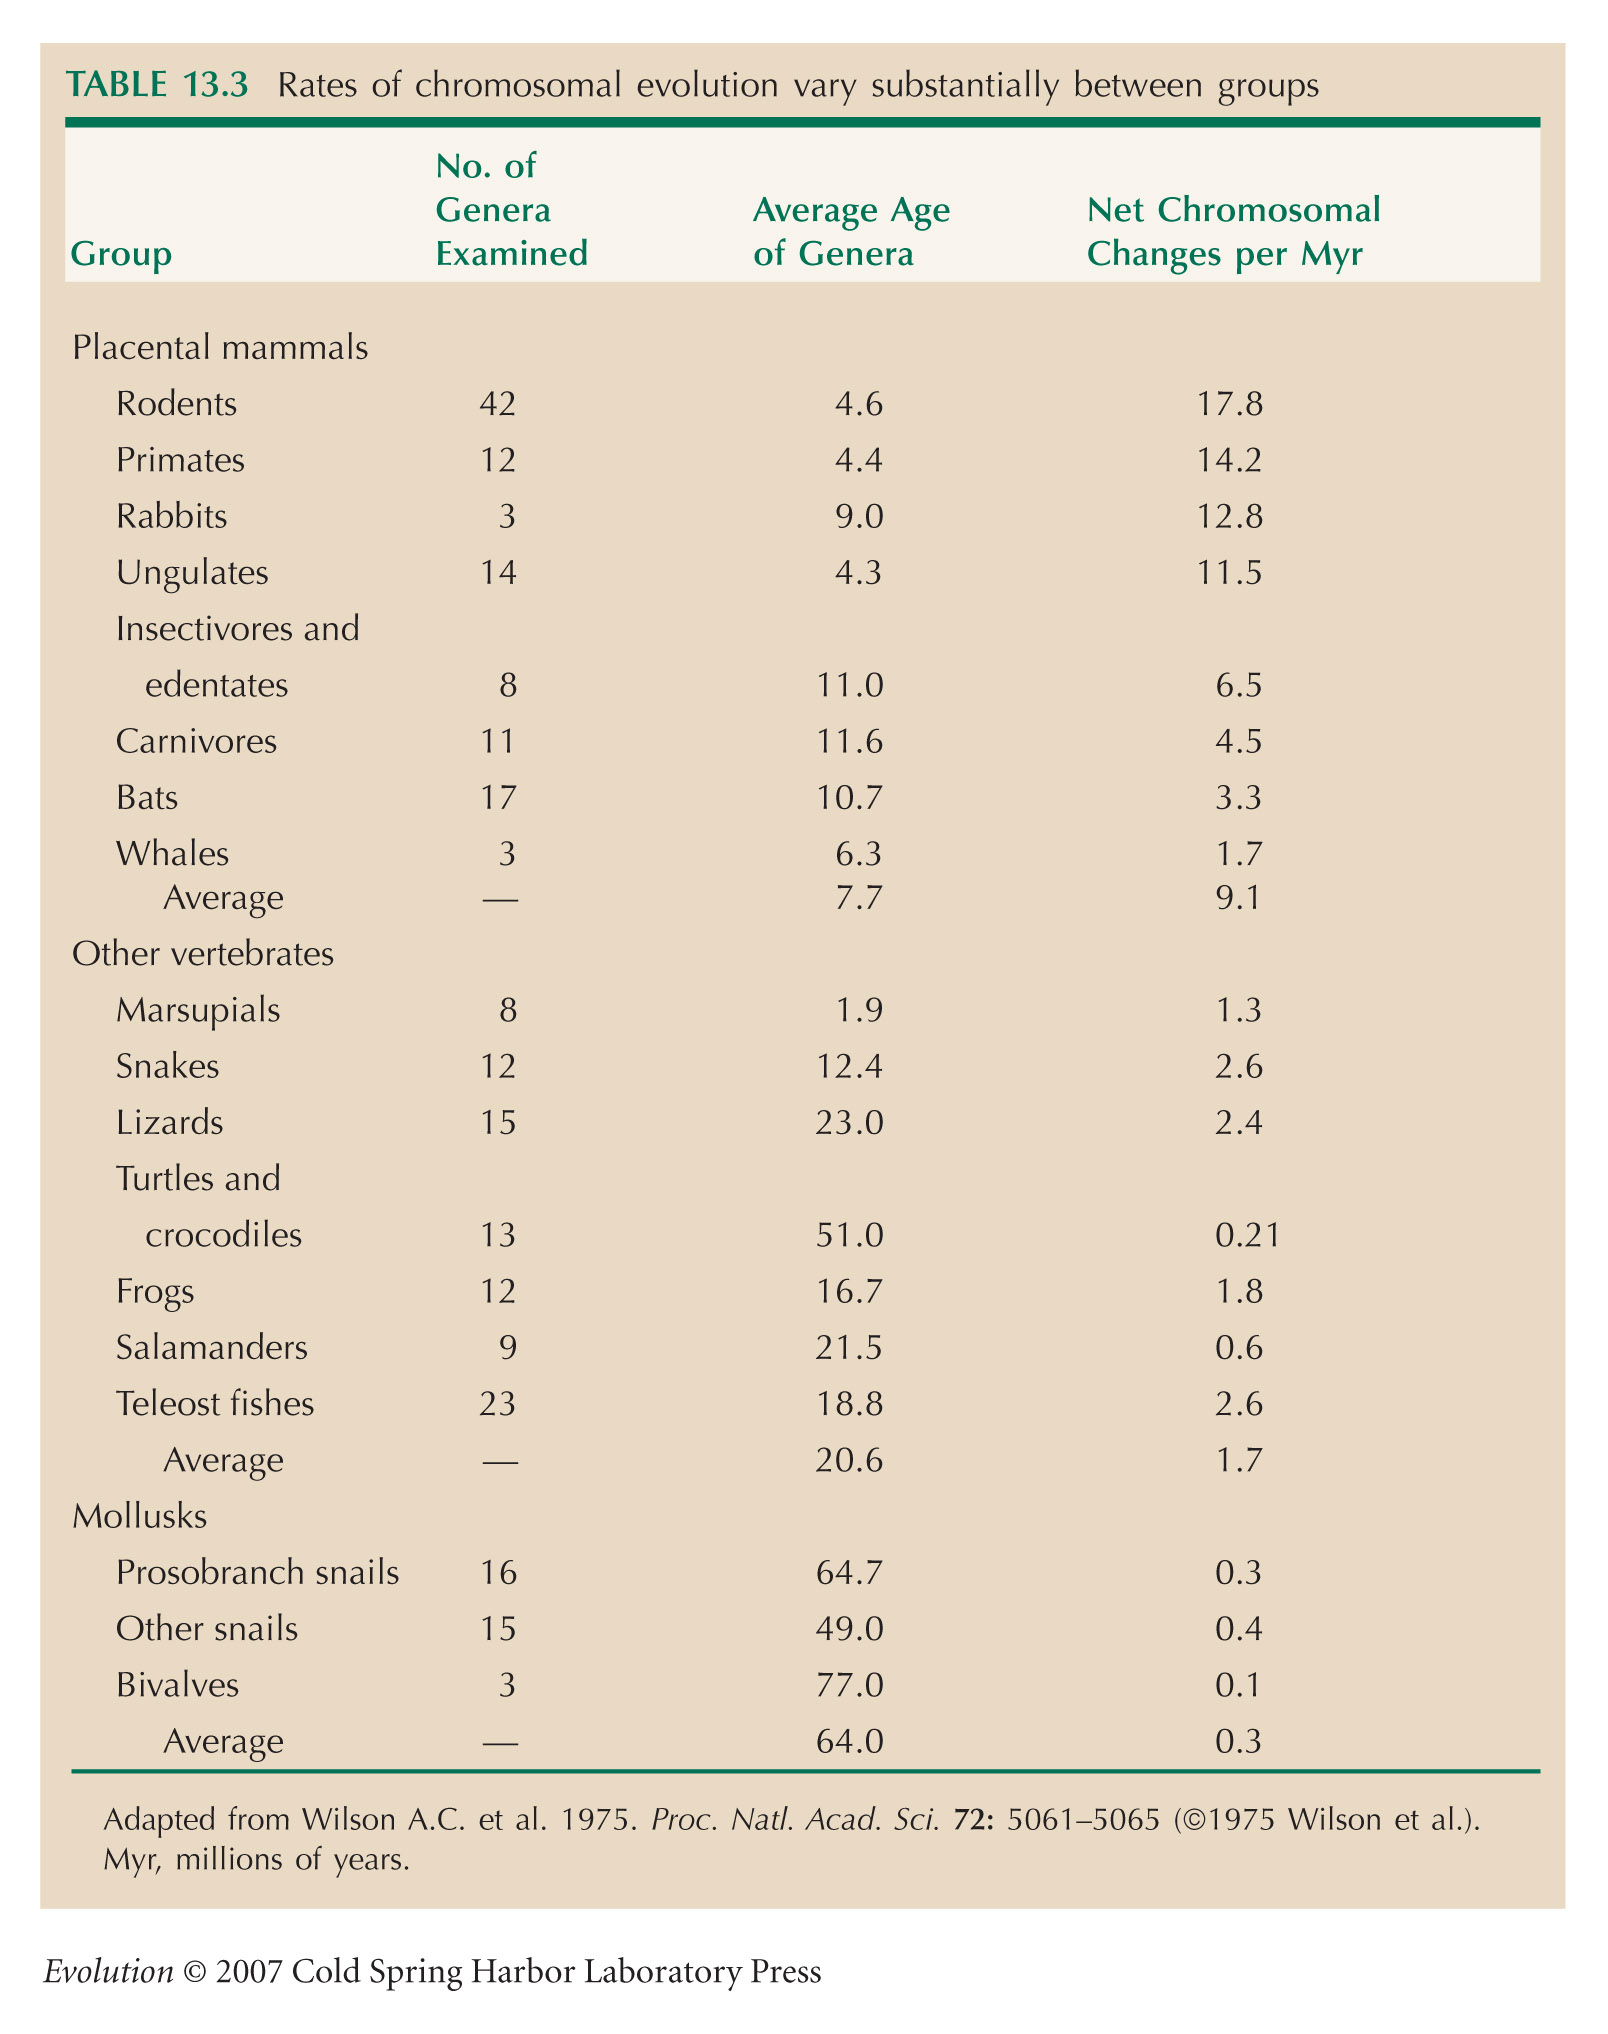
Rates of chromosomal evolution (Table 13.3) are from Wilson et al. (1975).
Lande (1979) reviews rates of chromosomal evolution; see also Jacobs (1981).
References
Aquadro C.F., Dene S.F., Bland M.M., Langley C.H., and Laurie-Ahlberg C.C. 1986. Molecular population genetics of the alcohol dehydrogenase region of Drosophila melanogaster. Genetics 114: 1165–1190.
Bancroft D.R., Pemberton J.M., and King P. 1995. Extensive protein and microsatellite variability in an isolated, cyclic ungulate population. Heredity 74: 326–336.
Bazin E., Glémin S., and Galtier N. 2006. Population size does not influence mitochondrial genetic diversity in animals. Science 312: 570–572.
Bentley D.R. 2003. DNA sequence variation of Homo sapiens. Cold Spring Harbor Symp. Quant. Biol. 68: 55–63.
Bishop J.A., Keill C., And Mcnair M.R. 1981. The number of genes on the second chromosome of Drosophila melanogaster and a comment on the genetic structure of eukaryotes. Heredity 46: 151–159.
Bonnell M.L. and Selander R.K. 1974. Elephant seals: Genetic variation and near extinction. Science 184: 908–909.
Cargill M., Altshuler D., Ireland J., Sklar P., Ardlie K., et al. 1999. Characterization of single-nucleotide polymorphisms in coding regions of human genes. Nat. Genet. 22: 231–238.
DeSalle R. and Grimaldi D.A. 1991. Morphological and molecular systematics of the Drosophilidae. Annu. Rev. Ecol. Syst. 22: 447–476.
Dobzhansky T. 1937. Genetics and the origin of species. Columbia University Press, New York. (Reissue edition: October 15, 1982; ISBN 0231054750—ppbk/.)
Eichler E.E. and Sankoff D. 2003. Structural dynamics of eukaryotic chromosome evolution. Science 301: 793–797.
Gibson G. and Dworkin I. 2004. Uncovering cryptic genetic variation. Nat. Rev. Genet. 5: 681–690.
Gibson G. and Hogness D.S. 1996. Effect of polymorphism in the Drosophila regulatory gene Ultrabithorax on homeotic stability. Science 271: 200–203.
Gillespie J.H. 1991. The causes of molecular evolution. Oxford University Press, Oxford.
Halushka M.K., Fan J.B., Bentley K., Hsie L., Shen N., Weder A., Cooper R., Lipshutz R., and Chakravarti A. 1999. Patterns of single-nucleotide polymorphisms in candidate genes for blood-pressure homeostasis. Nat. Genet. 22: 239–247.
Harris H. 1966. Enzyme polymorphisms in man. Proc. R. Soc. Lond. B 164: 298–310.
Hudson R.R. and Coyne J. 2002. Mathematical consequences of the genealogical species concept. Evolution 56: 1557–1565.
Jacobs P. A. 1981. Mutation rates of structural chromosome rearrangements in man. Am. J. Human Genet. 33: 44–54.
Kimura M. 1983. The neutral theory of molecular evolution. Cambridge University Press, Cambridge.
Kimura M. 1986. DNA and the neutral theory. Philos. Trans. R. Soc. Lond. B 312: 343–354.
Lewontin R.C. 1974. The genetic basis of evolutionary change. Columbia University Press, New York.
Lewontin R.C. and Hubby J.L. 1966. A molecular approach to the study of genic heterozygosity in natural populations. II. Amount of variation and degree of heterozygosity in natural populations of Drosophila pseudoobscura. Genetics 54: 595–609.
Lewontin R.C., Moore J.A., Provine W.B., and Wallace B. 1981. Dobzhansky’s “Genetics of natural populations” I–XLIII. Columbia University Press, New York.
Livingston R.J., Von Niederhausern A., Jegga A.G., Crawford D.C., Carlson C.S., et al. 2004. Pattern of sequence variation across 213 environmental response genes. Genome Res. 14: 1821–1831.
Lynch M. and Conery J.S. 2003. The origins of genome complexity. Science 302: 1401–1404.
Milkman R. 1973. Electrophoretic variation in E. coli from natural sources. Science 182: 1024–1026.
Mulligan C.J., Kitchen A., and Miyamoto M.M. 2006. Comment on “Population size does not influence mitochondrial genetic diversity in animals.” Science 314: 1390.
Nei M. and Graur D. 1984. Extent of protein polymorphism and the neutral mutation theory. Evol. Biol. 17: 73–118.
Nevo E., Beiles A., and Ben-Shlomo R. 1984. The evolutionary significance of genetic diversity: Ecological, demographic and life history correlates. In Lecture notes in Biomathematics (managing ed. S. Levin), vol. 53: Evolutionary Dynamics of Genetic Diversity (ed. G.S. Mani), pp. 13–213. Springer-Verlag, Berlin.
Patil N., Berno A.J., Hinds D.A., Barrett W.A., Doshi J.M., et al. 2001. Blocks of limited haplotype diversity revealed by high-resolution scanning of human chromosome 21. Science 294: 1719–1723.
Pavan C., Cordeiro A.R., Dobzhansky N., Dobzhansky T., Malogolowkin C., Spassky B., and Wedel M. 1951. Concealed genic variability in Brazilian populations of Drosophila willistoni. Genetics 36: 13–30.
Powell J.R., Caccone A., Amato G.D., and Yoon C. 1986. Rates of nucleotide substitution in Drosophila mitochondrial DNA and nuclear DNA are similar. Proc. Natl. Acad. Sci. 83: 9090–9093.
Reich D.E., Schaffner S.F., Daly M.J., McVean G.A.T., Mullikin J.C., Higgins J.M., Richter D.J., Lander E.S., and Altshuler D. 2002. Human genome sequence variation and the influence of gene history, mutation and recombination. Nat. Genet. 32: 135–142.
Sachidanandam R., Weissman D., Schmidt S.C., Kakol J.M., Stein L.D., et al. The International SNP Map Working Group. 2001. A map of human genome sequence variation containing 1.42 million single nucleotide polymorphisms. Nature 409: 928–933.
Sankoff D. 2003. Rearrangements and chromosomal evolution. Curr. Opin. Genet. Dev. 13: 583–587.
Sebat J., Lakshmi B., Troge J., Alexander J., Young J., et al. 2004. Large-scale copy number polymorphism in the human genome. Science 305: 525–528.
Selander R.K. and Levin B.R. 1980. Genetic divergence and structure in Escherichia coli populations. Science 210: 545–547.
Shaw K.L. 2002. Conflict between nuclear and mitochondrial DNA phylogenies of a recent species radiation: What mtDNA reveals and conceals about modes of speciation in Hawaiian crickets. Proc. Natl. Acad. Sci. 99: 16122–16127.
Sibley C.G. and Ahlquist J.E. 1986. Reconstructing bird phylogeny by comparing DNAs. Sci. Amer. 254(2): 68–79 (USA issue).
Small K.S., Brudno M., Hill M.M., and Sidow A. 2007. Extreme genomic variation in a natural population. Proc. Natl. Acad. Sci. 104: 5698–5703.
Valdes A.M., Slatkin M., and Freimer N.B. 1993. Allele frequencies at microsatellite loci: The stepwise model revisited. Genetics 133: 737–749.
Waddington C.H. 1956. Genetic assimilation of the bithorax phenotype. Evolution 10: 1–13.
Wilson A.C., Bush G.L., Case S.M., and King M.C. 1975. Social structuring of mammalian populations and rate of chromosomal evolution. Proc. Natl. Acad. Sci. 72: 5061–5065.
Wright S., Dobzhansky T., and Hovanitz W. 1942. Genetics of natural populations. VII. The allelism of lethals in the third chromosome of Drosophila pseudoobscura. Genetics 27: 363–394.
Xiang Q.-Y., Soltis D.E., Soltis P.S., Steven R.M., and Crawford D.J. 2000. Timing the Eastern Asian–Eastern North American floristic disjunction: Molecular clock corroborates paleontological estimates. Mol. Phylogenet. Evol. 15: 462–472.
|


