The Total Response to Selection on a Quantitative Trait
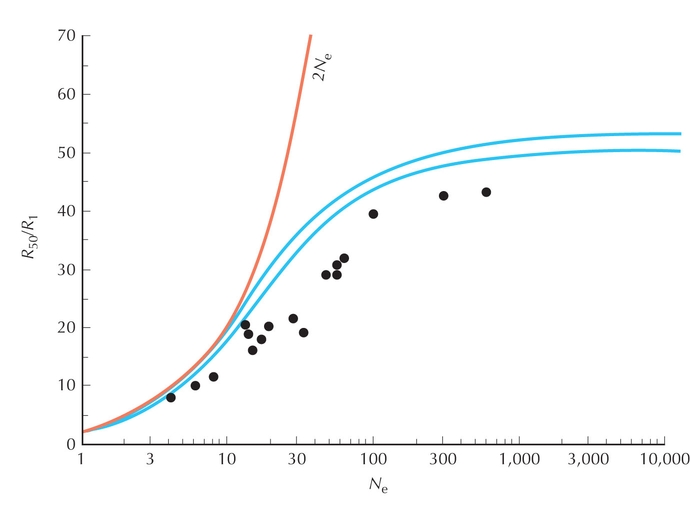
Figure WN18.1.
The ratio between the selection response at 50 generations and the response in the first generation (R50/R1), plotted against effective population size, Ne. These data points, compiled from a range of selection experiments, lie just below Robertson’s (1960) prediction for the response at 50 generations (lower curve). Allowing for the effects of mutation (VM/VG = 0.001) makes little difference (middle curve), supporting the argument on pp. 483–484 that new mutations contribute little over this timescale. The points lie below the prediction because selection as well as drift erodes genetic variance. (Upper curve) Robertson’s prediction for the ultimate response (R/R1 = 2Ne). (From Weber and Diggins 1990, Fig. 4.)
|


