 |
|
|
|
|
Evolution Chapter 21 Answers
|
Answer 21.1
|
| i) |
A fraction c of the 2pq heterozygotes produce all AP alleles, instead of half AP and half AQ. So, the excess of AP alleles produced by gene conversion is Δp = c × (1/2) × 2pq = cpq. This is almost (but not quite) equal to the effect of selection s on haploids (Δp = spq/(1 + sp) if fitnesses are 1:1 + s; Box 17.1).
|
| ii) |
It is simplest to assume that change is approximately continuous in time (accurate for c << 1). Then, we have dp/dt ~ cpq, and using the results in Box 28.2, the time taken to go from p0 = 0.01 to p1 = 0.99 is Δt = (1/c)loge((p1/q1)/(p0/q0)) = 1000 loge(1002) = 9210 generations.
|
|
Answer 21.2
|
| i) |
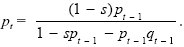
In flowering plants, the mitochondrial genome is transmitted maternally, and so we only need consider the contribution through ovules. Male-sterile plants produce 50% more seeds, and so the ratio of allele frequencies increases by a factor of 1.5 in every generation. After t generations, therefore, the frequency of male sterility, pt, will be given by pt/qt = (p0/q0) 1.5t, with p0 = 0.01, q0 = 0.99 (see Eq. 17.1). As male-sterile plants become more common, the amount of pollen produced by the population will decrease in proportion to the declining frequency of male-fertile plants, qt. However, because the sterility alleles are transmitted only maternally, this does not change their rate of relative increase.
|
| ii) |
Under uncrowded conditions, the number of surviving seeds produced by a male-sterile plant, which are successfully pollinated, is 15(1 – exp(–10q)). For the population to maintain itself, it must be able to increase from low density, and so this number must equal 1. Hence, the critical frequency of male-sterile plants is p = 1 – q = 1 + (1/10) loge(1 – 1/15) = 0.993. (This can be found by seeing where the line at 1/15 crosses the graph of (1 – exp(–10q)) in Fig. P21.1.) At least ~0.7% of male-fertile plants must be present if the population is to sustain itself.
The time taken to reach this critical frequency pt = 0.993 from an initial frequency p0 = 0.01 is given by (pt/qt)(p0/q0) = 1.5t, or t ~ 24 generations.
|
| iii) |
Every plant is produced by one male and one female gamete, and if population size is steady, on average, every plant produces one offspring via pollen and one via ovule. Now, the fraction q of male-fertile plants is responsible for all the fertilizations, and so each male-fertile plant on average produces 1/q offspring by pollination. (The male-sterile plants produce none, and so the average number produced, over the whole population, is 1.) Similarly, male-sterile plants produce 1.5 times as many ovules as male-fertile plants, and so male-fertile plants produce 1/2.5 = 0.4 offspring via ovules. The net fitnesses are 0.4 + 1/q:0.6.
|
| iv) |
A dominant allele that restores male fertility will produce 0.4 + 1/q offspring even if it finds itself with mitochondria carrying the sterility allele. Therefore, it will increase at a rate (0.4 + 1/q)/0.6, which is 167.33 for q = 0.01. This extremely strong selective advantage will raise the restorer allele to high frequency before the population becomes extinct.
|
| v) |
If the restorer allele has no effect other than to restore the fertility of individuals carrying the mitochondrial genome, then it will increase to fixation; as it does so, the sterility alleles will continue to increase but at a slower rate; that is, they still get an advantage when coupled with the nonrestorer genotype. However, it may take a long time to reach the final state where both are fixed, because the selection gets very weak as the restorer becomes common. NOTE 21E
|
|
Answer 21.3
|
| i) |
Infected females produce the same number of eggs as in the absence of Wolbachia, but uninfected females mate with infected males a fraction p = 10% of the time, and so their fitness is reduced by a factor q = 90%. The mean fitness is therefore p + q(1 – p) = 1 – pq = 0.91. Therefore, the new proportion of infected females is p1 = p0/(1 – p0q0) ~ 11.0%.
|
| ii) |
Iterating this expression over ten generations gives p = {0.1, 0.110, 0.122, 0.136, 0.155, 0.178}. If the initial frequency is 0.01, increase is far slower: p = {0.0100, 0.0101, 0.0102, 0.0103, 0.0104, 0.0105, ...}. This is because the Wolbachia gains an advantage only by reducing the fitness of its competitors, not by increasing its own fitness. Therefore, its advantage is small when it is rare, so that the reduction in the competitors’ fitness is small. Figure P21.3 shows a useful way to iterate expressions like this using a graph.
|
| iii) |
Now, the fitnesses of uninfected and infected females are (1 – p) and (1 – s), respectively. Therefore, the allele frequency changes as:
See Figure P21.4.
We see that if the infection is below a threshold frequency p* = s = 5%, then it will decrease. This is because the advantage gained through sterilizing uninfected females is very weak when the infection is rare (see ii)). The infection might spread if rates of immigration into local demes are very high or if the population is spatially continuous. Alternatively, the infection might drift above the threshold frequency by chance in a small local population. The issues here are similar to those involved in the spread of chromosome rearrangements that reduce fertility of heterozygotes and so also cannot increase when below a threshold frequency (see pp. 641–642). NOTE 21F
|
|
Answer 21.4
|
| i) |
With just nCP present, we have nCP* = nCP2 12 exp(–nCP). This is plotted in Figure P21.5 (upper curve). We see that when nCP is very small (<0.09), its numbers shrink to extinction (i.e., the curve is below the diagonal in Fig. P21.5). However, there is a second equilibrium at high density (nCP = 3.83; blue dot). This threshold behavior (known as an Allee effect) arises because both components C and P are needed for reproduction: A similar effect arises in sexually reproducing populations, where two individuals are needed for reproduction. NOTE 21G
|
| ii) |
What is the fitness of type nC, when the population is almost entirely nCP? We have nC* = α (nC/nCP)nCP2 12 exp(–nCP) and know that nCP = nCP2 12 exp(–nCP). Therefore, nC* = α nC, and so nC increases. We can see that nC will invade and, by the same argument, so will nP. (We did not really need the algebra here: It is obvious that nC and nP have α times the fitness of nCP, which is 1 at this equilibrium.) NOTE 21H
|
| iii) |
By the same argument as in i), but setting nC = nP = N/2, we have N* = nC nP 12 exp(–N) = (N2/4) 12 exp(–N). Therefore, there is an equilibrium at N = 1.51 (lower curve in Fig. P21.5).
|
| iv) |
Can type CP invade? We have nCP* = (nCP/α N)(N2/4) 12 exp(–N). But, because at equilibrium N = (N2/4)12 exp(–N), we have that nCP* = nCP/α, and we see that it cannot invade. It is perhaps counterintuitive that a type that, if it did invade, would increase population size substantially cannot displace the two complementary genotypes. This is an example where the conflict between selection on individuals, and on the population as a whole, leads to reduced population fitness.
|
|
Answer 21.5
|
| i) |
Female t/+ mice will pass on one copy of t on average, in a steady population. However, male t/+ mice will pass on two copies, on average, and so the t allele will increase by a factor 1.5 in every generation, starting at low frequency.
|
| ii) |
If the +/+ homozygotes are negligibly rare, we must follow males and females that are heterozygous, t/+. The only fertile males will be t/+, which produce entirely t sperm. Thus, although t/+ females produce on average one t/+ offspring and one t/t offspring, the t/+ males will mainly mate with tt females, and produce entirely tt offspring. So, the number of t/+ decreases by a factor 1/2 in every generation, even though a smaller and smaller fraction of the population is fertile. NOTE 21I
|
| iii) |
The initial increase of t from low frequency will be exactly the same as for the t allele (see i)): When t is rare, it will hardly ever form inviable homozygotes. To see what happens when it becomes common, suppose that there are two genotypes in the population: +/+ and t/+. Let their frequencies be u, v, respectively (u + v = 1). +/+ are produced from +/+ by +/+ matings and by matings between +/+ males and t/+ females (with frequency 1/2). However, t/+ by t/+ matings produce entirely t/+ because the males produce only t sperm and the t/t die. Therefore, the new frequency of +/+ is u* = u2 + uv/2 = u(1 – v/2) < u. The +/+ genotype will be eliminated leaving only t/+. from low frequency will be exactly the same as for the t allele (see i)): When t is rare, it will hardly ever form inviable homozygotes. To see what happens when it becomes common, suppose that there are two genotypes in the population: +/+ and t/+. Let their frequencies be u, v, respectively (u + v = 1). +/+ are produced from +/+ by +/+ matings and by matings between +/+ males and t/+ females (with frequency 1/2). However, t/+ by t/+ matings produce entirely t/+ because the males produce only t sperm and the t/t die. Therefore, the new frequency of +/+ is u* = u2 + uv/2 = u(1 – v/2) < u. The +/+ genotype will be eliminated leaving only t/+.
|
| iv) |
There will be rare t/+ and t/t mice, in a population of mainly t/+ heterozygotes. The bulk of the population will mate to produce entirely t/+ litters (t/t die early and are replaced by t/+ siblings). A t/+ male will produce only t sperm; he will mate with t/+ females and produce half t/+ and half t/t offspring. A t/+ female will receive t sperm, and produce t/t and t/+ in the same way. A t/t male will be sterile, but a t/t female will produce entirely t/t offspring—two on average in a steady population. Overall, the t alelle stays at the same frequency. Reasoning in the same way, one can see that a mixture of t/t and t/+ will stay in the same proportions—even though a t/+ population is fully fertile, whereas t/t are male sterile. NOTE 21J
|
|
Answer 21.6
|
| i) |
On average, in a population of steady size, a randomly chosen allele would be expected to pass on one copy. An allele that reduced its bearer’s mortality by 10% would therefore expect to pass on 0.9 copies directly. On average, each individual has one sibling. Each gene in the sibling has probability of identity by descent of 1/4, and so the sibling carries, on average, 1/2 a gene that is IBD with the individual in question. (To see this directly, note that the new allele must be present in a single copy in one of the parents and has a 50% chance of being passed on to the sibling.) So, a 30% reduction in the sibling’s mortality implies an extra 0.15 copies of the allele, which outweighs the direct loss of 10%: It will tend to spread. In terms of Hamilton’s rule, r × B > C, where r = 0.5, B = 0.3, and C = 0.1. NOTE 21K
|
| ii) |
Two-thirds of the copies of this allele will be in daughters. In this case, it is expected that the allele will be passed on in 0.9 copies directly. The allele is equally likely to have come from the mother or from the father, since the daughter gets one X chromosome from each. If it came from the mother, then that mother has a 50% chance of passing it to her daughter or to her son. If it came from the father, then it is certain to go to one of his daughters, but it cannot go to one of his sons. (Sons are male because they get the Y chromosome from their father.) Thus, overall, an allele in a daughter is expected to find 0.5 copies in a sibling, just as for an autosomal allele.
We must also consider an allele in a son. This will be passed on to all his daughters and none of his sons: On average, taking account of the reduced survival, we expect 0.9 copies to be passed on, because a father can expect to have one daughter. A son definitely received his X chromosome from his mother, who has a 50% chance of passing it to his sibling, whether male or female. So again, the allele is expected to gain 0.3 × 0.5 copies. The allele will therefore spread at the same rate as that in i). NOTE 21L
|
| iii) |
We can now follow the same argument through, but counting only gains to the sisters’ fitness. The 2/3 of genes in daughters expect to pass on 0.9 copies directly, as before. There is a 25% chance that such an allele came from the mother and that it is shared with a sister, but a 50% chance that it came from the father and was passed on to a sister. So, the net gain is 0.3 × (0.25 + 0.5) = 0.225. The 1/3 of alleles in sons certainly came from the mother and have a 50% chance of being found in a sister if the sibling is a sister (probability = 50%). So, the net gain is 0.3 × 0.25 = 0.075 copies. Thus, the overall number of copies passed on indirectly is (2/3)0.225 + (1/3)0.075 = 0.175. There is still a net gain, with the total number of copies passed on being 0.9 + 0.175 = 1.075. For an autosomal allele that benefited sisters in the same way, the net fitness would be 0.9 + 0.075 = 0.975: This would decrease. An X-linked allele is found more often in females and so gains more from altruism to sisters.
|
|
Answer 21.7
|
| i) |
If the ratio of females to males is q:p, then a son has value q/p, because there are q females who must be fertilized by p males. Similarly, daughters have value p/q.
|
| ii) |
If the female fertilizes an egg, producing a daughter instead of a son, then one maternal gene will be passed on and, in addition, one paternal gene will also be passed on, which has a chance F of being IBD with a maternal gene. The total number of genes that the female passes on via a daughter is therefore 1 + F. If she leaves the egg unfertilized, then she just passes on one maternal gene.
|
| iii) |
At equilibrium, the net fitness gained by a female must be the same whether or not she fertilizes her egg. (Otherwise, an allele that increased or decreased the sex ratio would invade.) Therefore, q/p = 1 + F, and so the proportion of males is p = 1/(2 + F).
|
| iv) |
Assuming that all n foundresses produce the same number of sons, a daughter has a chance 1/n of mating with a brother, who got his haploid genome from the mother. If this happens, then the daughter takes an extra copy of the mothers’ genome out of the fig. NOTE 21M So, the net fitness gain to the mother is 1 + F + 1/n.
|
| v) |
If the mother produces an unfertilized egg, and hence a son, there is a chance 1/n that this will simply displace his brother and give no net benefit. Therefore, the net fitness gain to the mother from a son is (1 – 1/n)(q/p).
|
| vi) |
At equilibrium we have (1 – 1/n)(q/p) = (1 + F + 1/n). Thus, the proportion of males is p = (1 – 1/n)(1/(2 + F)).
|
|
Answer 21.8
|
| i) |
If each of the ten embryos were allocated z = 5/10 = 1/2 units of resource, the total fitness would be
|
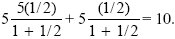
| ii) |
If resources are concentrated on the five high-quality seeds, each getting z = 1, the total fitness is 5[5/(1 + 1)] = 12.5, which is higher.
|
| iii) |
We could plot the total fitness against z, the allocation to each of the five fitter seeds. Because the total available is 5, 0 ≤ z ≤ 1, and the resource remaining for each of the other five is 1 – z. Thus, total fitness is 5[5z/(1 + z)] + 5 (1 – z)/(2 – z) (see Fig. P21.6). The total fitness is maximized by allocation to the high-quality seeds, and so this is the optimal strategy for the parent plant. NOTE 21N
Another way to show that allocation entirely to the high-quality seeds maximizes total fitness is to think about the fitness gained from allocating a small amount of resource to the low-quality seeds. An amount δz will yield an extra
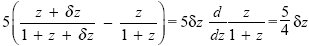
from the high-quality seeds, where z = 1 is the existing allocation. It would yield an extra
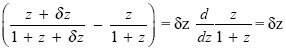
if allocated to the low-quality seeds. Therefore, it is better to allocate more resources to the high-quality seeds. (This argument amounts to showing that the slope in Fig. P21.6 is positive at z = 1.)
|
| iv) |
From the point of view of a gene inherited from the male parent, all that matters is to maximize its own fitness. The optimal allocation is therefore to give all the resource, z = 5, to that one seed, yielding 5(5/6) = 4.167 if it is a high-quality seed, and one-fifth that if it is low quality. This is clearly much worse from the point of view of the parent plant. NOTE 21O
|
| v) |
The answer is the same: 4.167 for a high-quality embryo.
|
| vi) |
Now, suppose that z is allocated to the high-quality embryo carrying the gene in question, and the remaining (5 – z) spread evenly over the four other high-quality embryos. The allele from the mother has a 50% chance of being in the four siblings, and so the net fitness gain is
This is maximized at z = 1.61, yielding total fitness 7.67 (blue curve in Fig. P21.7).
|
| vii) |
Because there are diminishing returns with increasing resource allocation, an even distribution across similar individuals is always best. Thus, the optimal allocation must be to allocate some resource to the focal individual, some evenly to the high-quality siblings, and some evenly to the low-quality siblings. In vi), we saw that an allele from the mother that is in a high-quality embryo maximizes its fitness when some resource is given to it (z = 1.61) and the rest to its high-quality siblings. The remaining question is whether it is worth allocating some resource δz to low-quality siblings. The gain from that would be (1/2)((z + δz)/(1 + z + δz) – z/(1 + z)) = δz/2, where z = 0 currently. The fitness gain from a high-quality sibling is (5/2)((z + δz)/(1 + z + δz) – z/(1 + z)) = 0.73δz, where z = (5 – 1.61)/4 currently. Therefore, it does not pay to allocate resources to low-quality siblings.
|
| viii) |
The fitness if all resources go to this one embryo is 5/(1 + 5) = 0.833. Then, the gain from allocating δz to a high-quality sib is (5/2)((z + δz)/(1 + z + δz) – z/(1 + z)) = 2.5δz. The gain from allocating an extra δz to the focal low-quality embryo is ((z + δz)/(1 + z + δz) – z/(1 + z)) = 0.029δz, where z = 5 is the current allocation. This is far lower, implying that the optimal strategy has at least some resource going to high-quality siblings. However, if all resources went to them, the net fitness would be 5(5/2)(z/(1 + z)), with z = 1, giving (25/4) = 6.25. If we look at that strategy, then the fitness gain to giving a little resource δz to the focal individual (currently at z = 0) would be δz, and the fitness gain to giving a little more to a high-fitness sibling would be (5/2)((z + δz)/(1 + z + δz) – z/(1 + z)) = 0.625δz, where z = 1 is the current allocation. So, the optimal allocation must be intermediate. Plotting the net fitness,
shows that it is at z = 0.235, with very little resource allocated to the individual itself (Fig. P21.8). NOTE 21P
|
|
Answer 21.9
|
| i) |
In the absence of extinction, this very low rate of migration would allow random drift to almost eliminate variation within demes: For a haploid population, with N genes per deme, FST = 1/(1 + 2Nm) ~ 0.98 (see Box 16.2). Thus, we can assume that demes are almost always fixed for one of the alleles.
|
| ii) |
In one generation, λP of demes fixed for AP become extinct. A total of pλP + qλQ patches become empty and are recolonized by random individuals drawn from the surviving demes. So, p* = (1 – λP)p + (pλP + qλQ) , where is the fraction of surviving demes that are fixed for AP: , where is the fraction of surviving demes that are fixed for AP:
The change in p is thus
This is the same as the formula for the change in allele frequency under selection within a population (see Box 17.1), with extinction rates λ replacing death rates, s. In this case, group selection is relatively effective, because most genetic variation is between demes, not within them: With λP = 0.05, λQ = 0.1, we have an effective selection coefficient (λQ – λP) = 0.05.
|
| iii) |
Now, suppose that allele AQ tends to increase within demes but also increases extinction risk as it does so. We then have a competition between two processes: establishment and spread within AP demes and, subsequently, more rapid extinction of demes fixed for AQ. AQ alleles will enter a deme fixed for AP at a rate Nmq in every generation (the factor q being the fraction of the population supplying AQ alleles). They then have probability 2s of becoming established and eventually fixing (see p. 489). So, the rate of conversion of AP to AQ is 2Nms per generation. We then have the rate of change ~ λP(λP – λQ)pq in the opposite direction. The rates of these two processes are 2 × 0.01 × 0.1 = 0.002, and (0.1 – 0.05) = 0.05, respectively. So, selection between demes outweighs selection within them, because there is so little within-deme diversity. NOTE 21Q NOTE 21R
|
|
Answer 21.10
|
| i) |
The bulk of the population always defects, and so has an average payoff of 1. Rare individuals that play tit-for-tat will cooperate on their first encounter, and so only receive a payoff of 0. Afterward, they will always defect, and so get the same payoff of 1 as the rest of the population. Overall then, they do worse, and this strategy cannot invade from low frequency.
|
| ii) |
If all individuals play tit-for-tat, then they will all cooperate and get a payoff of 3. Rare individuals that defect will gain 5 on the first encounter, but 1 thereafter; with an average of three encounters, their average gain is (5 + 1 + 1)/3 ~ 2.33. Thus, defectors cannot invade from low frequency.
|
| iii) |
Tit-for-tat cannot invade unless it increases above a critical threshold frequency, such that they meet each other and make substantial gains by cooperating. In small populations, the strategy might increase by chance, in the same way that a chromosomal rearrangement that is disadvantageous in heterozygotes can fix by chance (see p. 641). More frequent interactions between the same individuals, or a better ability to discriminate others, would help but would still not allow increase from low frequency.
|
References
Turelli M. and Hoffmann A.A. 1995. Cytoplasmic incompatibility in Drosophila simulans: Dynamics and parameter estimates from natural populations. Genetics 140: 1319–1338.
|
|
|


