Chapter 27
Phylogenetic Reconstruction
 A phylogenetic tree is the only figure in On the Origin of Species, evidence of the central importance of such trees to evolutionary biology. As discussed in Chapter 5, a phylogenetic tree is a graphical representation of the evolutionary relationships among entities that share a common ancestor. Those entities can be species, genes, genomes, or any other operational taxonomic unit (OTU). More specifically, a phylogenetic tree, with its pattern of branching, represents the descent from a common ancestor into distinct lineages. It is critical to understand that the branching patterns and branch lengths that make up a phylogenetic tree can rarely be observed directly, but rather they must be inferred from other information. A phylogenetic tree is the only figure in On the Origin of Species, evidence of the central importance of such trees to evolutionary biology. As discussed in Chapter 5, a phylogenetic tree is a graphical representation of the evolutionary relationships among entities that share a common ancestor. Those entities can be species, genes, genomes, or any other operational taxonomic unit (OTU). More specifically, a phylogenetic tree, with its pattern of branching, represents the descent from a common ancestor into distinct lineages. It is critical to understand that the branching patterns and branch lengths that make up a phylogenetic tree can rarely be observed directly, but rather they must be inferred from other information.
The principle underlying phylogenetic inference is quite simple: Analysis of the similarities and differences among biological entities can be used to infer the evolutionary history of those entities. However, in practice, taking the end points of evolution and inferring their history is not straightforward. The goal of this chapter is to discuss both the principles and methods used in phylogenetic inference as well as some of the complications.
In the first section, we discuss the process of selecting and gathering appropriate datasets for subsequent analysis. In the next section, we explain three widely used methods of phylogenetic inference: parsimony, distance, and likelihood methods. This is followed by a discussion of how these methods can be evaluated objectively and how the reliability and accuracy of their resultant inferences are assessed. We then raise several problematic issues that must be considered when using any phylogenetic method. Finally, we consider the fruits of phylogenetic reconstruction—how it can shed light on past evolutionary events, such as gene duplications and lateral gene transfers, as well as how it can be used for other purposes, such as predicting gene function and resolving RNA secondary structures.
Essentials of Phylogenetic Inference
To understand how phylogenetic inference works, it is useful to consider the comparatively simple case of evolution in an asexual unicellular organism. Each cell divides, yielding two cells with identical genomes except for those few genomic locations where a mutation occurred. Now imagine this continuing for 100 generations, yielding 2100 cells. Suppose ten cells are sampled from the final population and compared to one another. Two cells that share a recent common ancestor (i.e., they diverged recently) are apt to have accumulated fewer differences than a pair that diverged earlier, whose last common ancestor was many generations ago. Thus, theoretically, one should be able to infer the lineages leading up to those cells over the course of the 100 generations by analyzing their similarities and differences. In practice, however, inferring history, even in this simplified situation, is not completely straightforward, and, of course, evolution rarely follows the simple scenario outlined above. This section discusses some of the various reasons why phylogenetic inference is not completely straightforward.
One challenge in phylogenetic inference is that the accumulation of differences in different lineages usually does not occur uniformly. That is, one branch may experience many changes, whereas another branch may experience none. For example, in the cell division case given above, if by chance many more mutations occurred on one branch than on the others during a period of time, the progeny cells on that branch would differ more from other cells in the population than would be expected. In addition, if one sampled descendants of this branch and included them in the phylogenetic inference, one might mistakenly infer that they were very distantly related from other cells. Because rates of divergence can vary a great deal in realistic evolutionary scenarios (e.g., because of random chance or of differences in mutation rates or selective pressures), it is common for similarity alone to not be an accurate indicator of the degree of relatedness. Thus, phylogenetic reconstruction methods need to account somehow for the variation in rates of divergence between lineages.
A second major challenge in phylogenetic reconstruction is that the notion of evolution as a branching process is an oversimplification and can lead to many misinterpretations. For example, in sexually reproducing species, recombination mixes and matches genetic variation to produce lineages whose history is not exclusively vertical and thus cannot be perfectly represented as a tree. Hybridization can lead to mixing and matching even between species, and in the case of lateral gene transfer (LGT), DNA can move across large evolutionary distances (see pp. 182–191). Furthermore, even within a genome, evolutionary processes can be quite complex with duplication, deletion, domain shuffling, and gene conversion occurring. All of this complexity means that one must be very careful in choosing which entities to study in a particular phylogenetic analysis. These entities are generally referred to as operational taxonomic units, or OTUs. The OTUs studied can be species, populations, chromosomes, individual genes, or even regions of genes. Frequently, one type of OTU (e.g., genes) is studied to represent the evolution of another (e.g., species). This must be done carefully because gene evolution and species evolution are not the same (see Section IV introduction and p. 628).
A third major challenge that greatly complicates phylogenetic inference is the occurrence of convergent and parallel evolution, which lead to lineages becoming more similar to each other over time, at least in some features. This occurrence of similarities that are not due to common ancestry is known as homoplasy. This raises a critical issue for phylogenetic analysis—only traits that are homologous and in which the observed similarities are not due to convergence or parallel evolution should be compared and contrasted. More specifically, homologous character traits that have different character states in the different OTUs should be identified (see pp. 117-119 for more on traits and states). For example, in studies of vertebrate evolution, a specific bone could be considered the character trait because homologous bones can be identified in many taxa. The form of that bone (e.g., its size, shape, or density) would then be the character state. For molecular data, a two-tiered approach is often used to identify homologous character traits. First, homologous elements (e.g., genes) are identified, and the sequences of these from all the OTUs are aligned so that individual columns in the sequence alignments correspond to putatively homologous character traits. The end result is the generation of a data matrix with OTUs and character traits as the headers and character states as the entries in the boxes (Table 27.1).
These three problems (unequal rates, nonvertical evolution, and homoplasy), as well as other challenges and complexities, have helped shape the development of methods for phylogenetic inference as well as the collection of data for phylogenetic studies. It is true that each method and data type has its strengths and weaknesses, but it should be kept in mind that despite the challenges, phylogenetic inference is remarkably accurate, successful, and useful.
Generating a Molecular Sequence Matrix
The issue of which traits to use for phylogenetic analysis has been the subject of much discussion. For example, there has been a running debate in the field of vertebrate evolution regarding the value of morphological character traits versus molecular traits. Although these debates can catalyze discussion of important issues, we believe that the “either/or” division that they sometimes imply is spurious. Instead, what is needed is a case-by-case evaluation using objective and relevant criteria, such as cost, accuracy of character state assignment, ease of inferring homology, lack of convergent evolution, number of possible character states and rate of change between them, and utility of the character information for other purposes.
For instructional purposes, the remainder of this chapter focuses on using molecular sequence data for phylogenetic reconstruction. This is not to say that such data are better or worse per se than any other type of data. However, it is useful to focus on sequence data here for several reasons. First, as the cost of sequencing has dropped, sequence data have become by far the least expensive data to gather for most studies. Second, analysis of sequence data allows one to study the molecular basis of evolution. Third, the analysis is somewhat more straightforward for molecular sequence data than for other types. The discrete and well-defined nature of the character traits (i.e., 4 nucleotides, 20 amino acids) makes quantifying trait evolution straightforward. Last, and most important, the principles that apply for molecular sequence data apply to other types of data as well.
The process of carrying out sequence-based phylogenetic analysis can be divided into four key steps (Fig. 27.1):
-
Select a sequence of interest. This could correspond to a whole gene, a region of a gene (coding or noncoding regions can be used), a regulatory region for a gene, a transposable element, or even a whole genome.
-
Identify homologs. Acquire sequence data for objects that are homologous to the sequence of interest
-
Align sequences. Align the sequence of interest and the homologous regions to generate a sequence data matrix.
-
Calculate phylogeny. Carry out phylogenetic inference on the alignment.
In this section, we discuss the first three steps. The last step—phylogenetic inference— is discussed in the section Methods Used to Infer Phylogenetic Trees.
Select a Sequence or Sequences of Interest
When undertaking a sequence-based phylogenetic analysis, the first question to ask is What sequences should be compared? If investigators are relying on data gathered by others, the choice may have already been made; however, in many cases, a choice regarding what should be compared will have to be made. In principle, anything from whole genomes to single genes can be compared. For individual genes, the whole gene, just the coding regions, or even single introns could be compared. It is not necessary to focus specifically on coding regions because promoters or intergenic spacers or other genome elements could be compared. In the end, no type of sequence is perfect for all purposes and the decision should be based on objective criteria, much like the choice of whether to use molecular or morphological data discussed above. A few examples of selection strategies are given here. Related issues are included throughout this chapter in conjunction with discussions of the methods of phylogenetic reconstruction.
One reason to select a particular type of sequence for a phylogenetic study is that it is much easier and/or less expensive to clone and sequence for the study in question. An excellent example of this is the use of the small subunit ribosomal RNA (ss-rRNA) gene for studies of microbial evolution, including both cultured organisms (e.g., building the tree of life) and uncultured organisms (e.g., see pp. 147–151). The main reason ss-rRNA is used for such studies is that the sequence of the molecule is so highly conserved between species that one set of primers can be used to amplify this gene using PCR (polymerase chain reaction) from nearly any bacteria or archaeal species. Of course, this is not the only reason this gene is used. Another reason it is used is that it can be used to study both ancient evolution (e.g., identifying whether something is an archaea or bacteria) and relatively recent evolution (e.g., determining if something is in the Escherichia or the Salmonella genus). This one gene can be used for this wide range of evolutionary depth because different regions of the molecule evolve at different rates.
There are, however, limitations to the utility of ss-rRNA. For example, unrelated thermophiles tend to converge on high G + C content in their rRNA genes (see p. 155), which makes it difficult to carry out accurate phylogenetic reconstructions. Thus, when studying organisms with very different growth temperatures, it is usually beneficial to analyze something other than rRNA. A second limitation of rRNA for phylogenetic analysis is that the rates of evolution of rRNA genes appear to vary more between species than the rates of evolution of some protein-coding genes. This has made some studies based on rRNA analysis, such as those of microbial eukaryotes, more prone to reconstruction artifacts such as long-branch attraction (see pp. 130–131 and p. 198 and later in this chapter). For these and other reasons, researchers frequently look to other sequence elements when rRNA rates of evolution vary greatly between the taxa being studied.
Perhaps the most significant limitation of rRNA for phylogenetic analysis is that even the most rapidly evolving regions generally do not evolve fast enough for this molecule to be used to study relatively recent evolution (e.g., relationships among species within genera or within species). When such recent evolutionary events are being studied, regions or genes that evolve much more rapidly are needed. One possibility is to use protein-coding genes, because the degeneracy of the genetic code means that even when a protein is completely conserved, the DNA sequence encoding that protein can vary. Or, if protein-coding regions do not vary enough, introns, or pseudogenes, or intergenic spacer regions can be used. However, protein-coding genes have a major advantage—even when the DNA sequence is not highly conserved, the amino acid sequence sometimes is, making alignments easier to create (see next section). Basically, the investigator needs to find some type of sequence element that varies enough between the OTUs such that each OTU has a reasonable number of differences with other OTUs.
Of course, the rate of change is not the only criterion to consider when selecting a gene or region of a genome to study. Another criterion is whether the element is prone to evolutionary events that may obscure or confuse the phylogenetic signal for which one is looking. For example, if comparisons of gene sequences are being used to study species evolution, then genes particularly prone to lateral gene transfer should not be used because their phylogenetic history will not parallel the species phylogeny. Genes that have undergone significant amounts of gene duplication need to be analyzed with care because orthologs (genes related to each other by speciation events, for which the phylogeny should roughly parallel the species phylogeny) must be distinguished from paralogs (genes related to each other by duplication events).
By no means have all of the possible criteria that could be used in the selection of sequences for phylogenetic analysis been discussed here. Instead, what has been illustrated is that one can use objective criteria to choose which genes to use for a particular phylogenetic reconstruction. Basically, the right sequences for the particular question being asked must be found.
Obtaining Sequences of Homologs—Approach 1: Sequencing
Once one or more elements have been selected for study, sequences of homologs of this element must be obtained from the different OTUs of interest (be they species, individuals, etc). There are diverse ways that sequence data can be gathered experimentally (something generally referred to as “sequencing”), and the technologies that are used change quite frequently. Some of the general approaches to sequencing that are of particular relevance to phylogenetic analysis are reviewed here.
The first critical aspect of sequencing is that the target for sequencing can be DNA, RNA, or protein. That is, any of these macromolecules can be isolated from samples, and then, using various techniques, the sequence of either nucleotides (in RNA and DNA) or amino acids (in proteins) can be read. Currently, protein sequencing is not used much in phylogenetic studies due to its high cost, low throughput, and relatively low accuracy. However, this may change as “proteomic” methods improve. The rest of this section focuses on RNA and DNA sequencing, from which the vast majority of data for phylogenetic analysis come. For RNA sequencing, a key concern is that RNA is much more chemically fragile than DNA. Thus, the samples for RNA sequencing must be stored very carefully (e.g., at very low temperatures and in buffers that prevent degradation) or the RNA can be converted to more stable DNA using the enzyme reverse transcriptase (the resulting DNA is known as cDNA). DNA, on the other hand, is reasonably stable, so that it is possible to obtain sequence information from samples stored in museums or that are thousands of years old.
One important aspect of DNA and RNA sequencing is that it can be done in either a targeted approach or a random approach. In the targeted approach, specific genes or genetic elements are selected in advance (e.g., see previous section), and methods to obtain just the sequences of the homologous regions in the OTUs of interest are used. Although the exact methods used to carry out targeted DNA and RNA sequencing vary, they almost always involve some form of PCR. Here, PCR is used to first make extra copies of the gene or region of interest, which then makes it easier to read the sequence of these regions, and primers for PCR that will amplify the gene or element of interest from a new source are used. Herein lies one of the big challenges for targeted sequencing. For phylogenetic analysis, a reasonable amount of variation in sequence between the OTUs being studied is desirable. However, for PCR to work, the reaction must be “primed” using small oligonucleotide primers that are identical or nearly identical to regions of the gene in the OTUs of interest.
The solution to this challenge is that PCR for evolutionary analysis can be used for those genes or elements that, in all of the samples of interest, have regions that vary in sequence and are flanked by regions that are highly conserved. Primers for PCR can be targeted for highly conserved sites, and the variable regions can then be amplified and sequenced. As discussed above, this is one of the reasons that ss-rRNA has been so frequently used as an evolutionary marker. This molecule contains both very highly conserved regions (where the DNA sequence is nearly identical across all cellular organisms such that some primers can be nearly “universal”) and moderately variable regions that serve as the grist of the mill of phylogenetic analysis (Fig. 27.2).
PCR for evolutionary analysis is a bit more challenging for protein-coding genes, because, as mentioned above, primer sites are required in which the DNA sequence is highly conserved between all targets. However, in protein-coding genes, it is the amino acid sequence of the protein that is under the most constraint, not the encoding DNA sequence. Even if one found highly conserved regions of amino acid sequence flanking highly variable regions, the primers for PCR need to target the DNA. Because the genetic code is redundant, regions that are highly conserved at the amino acid level may not be so conserved at the DNA level. This complication can be circumvented by designing “degenerate” PCR primers where all possible DNA bases are included to cover all possible ways that particular amino acid sequences could be encoded. Such degenerate primers work best when the degree of degeneracy is lowest. Thus, for PCR amplification of protein-coding genes, one searches for regions that are not only highly conserved at the amino acid level, but for which the conserved amino acids have low degeneracy (e.g., methionine is good because it can only be encoded by one codon, whereas leucine is less good because it can be encoded by six codons) (Fig. 27.2).
An alternative to the targeted sequencing of selected regions of particular genomes is to use a random approach. Here, the pitfalls of PCR and other targeted approaches are avoided, and random cDNA or genomic DNA regions are sequenced. This approach is, of course, the basis for genome sequencing methods and can be very powerful, in part because it provides large datasets but also because it can be automated, making the cost per base pair of information obtained very low. Once large amounts of sequence information are obtained using a random approach, genes or elements of interest can be identified in the data using computational database search methods (described below).
Obtaining Sequences of Homologs—Approach 2: Database Searching
Fortunately, the actual sequencing does not need to be done to obtain sequences of interest. Today, these can be obtained by searching sequence databases. Major online databases store both published and unpublished sequence information (examples are given in Table 27.2). In addition, thousands of smaller online databases focus on particular organisms, particular types of data, or data produced at particular institutions. Custom databases can also be made for searching that include information in public databases as well as private information (the results of a researcher’s own sequencing efforts), such as the random sequencing discussed above. Any of these databases can then be searched for sequences of interest using computational methods.
Diverse methods are available for searching for homologs of a sequence of interest in sequence databases. In essence, all of these methods carry out some type of sequence alignment where a query is scanned against the database in a search for sequences in the database that are similar to the query. The methods that are used vary both in what they use as a query and in how they identify and score similarity to the database. As basically the same methods are used to carry out multiple sequence alignments, we discuss them in the following section. For our purposes here, what is most important is that all database search methods use the same general principle. Matches are given a score depending on the type of match with the database, and the database searching tools then produce a table of scores or probabilities for each item in the database compared to the query. A cutoff is used to throw away weak matches, and the top matches are stored. We note that there are many ways to assign scores to matches, some of which are discussed in the next section. Finally, a decision must be made among the resulting matches as to which are truly homologs of interest and which are not.
This last step is critical and the source of many problems because similarity of sequence is not proof of homology. For example, when searching large sequence databases, investigators would expect to find short regions of similarity to their query sequence by chance alone. The larger the database, the more likely such spurious matches will occur. Even when apparently nonrandom similarities are found, the similar sequences are not necessarily homologs. Sequence similarity could be a reflection of homology, but it also could be the result of convergent or parallel evolution (also know as analogy).
How is sequence similarity due to homology distinguished from that due to analogy? One common approach is simply to set a conservative similarity threshold and to conclude that sequences are homologous only if they have very high levels of similarity. Another approach is to take each of the sequences in question and attempt to infer what its recent ancestors were like. This would be akin to studies of bird and bat wings, which we know are similar as a result of convergence because the relatively recent ancestors of bats did not have wings (Fig. 27.3). Most importantly, one must understand that homology is an inference and does not follow directly from measures of similarity.
Multiple Sequence Alignment Is a Critical Step in Phylogenetic Reconstruction from Gene Sequences
In theory, each homologous sequence could be treated as a single character trait for phylogenetic reconstruction. However, the great advantage of sequences for phylogenetic inference is that, in principle, each position in the sequence can be considered a separate character trait. For this to work, there needs to be a way of comparing individual homologous positions found in different homologous sequences. This is done by making sequence alignments, where, in essence, each sequence is assigned to a separate row in a matrix, and homologous positions in different sequences are lined up in columns. Such an alignment serves as the data matrix for phylogenetic analysis introduced earlier with the sequences in rows corresponding to OTUs, the columns corresponding to homologous traits, and the specific residue (amino acid or nucleotide base) in each sequence being the character states. It is critical to realize that the residues in one column are considered to be different states of a homologous trait. In other words, it is inferred that the residues in one column have been derived from a common residue in some ancestral sequence. This is known as positional homology.
If sequences simply evolved by changing the nucleotide found at one position to another nucleotide, alignments would not be particularly challenging—all one would need to do is find the starting point for each homologous set of elements, and the rest of the residues would then simply line up downstream from the start. However, evolution is much more complex. Perhaps the most important complexity for the purpose of alignments is the occurrence of insertions and deletions. Such insertion/deletion changes can be small (e.g., involving a single position) or large (e.g., inserting a new domain in the middle of a protein). When these occur in one or more lineages in the history of the evolution of a particular element, the homologous residues in different sequences will be out of register with each other. That is, position 10 in one sequence may line up with position 45 in a homologous sequence. Thus, to make an alignment for which the positional homology still holds in alignment columns, gaps must be inserted into the alignment. If a residue were deleted in one element relative to all others, then a gap would need to be inserted in the element that included the deletion to line it up with the others. If a residue were inserted in one element, a gap would need to be inserted in all of the others to have them line up with the element with the insertion.
Figure 27.4 shows an example of how adding gaps can improve an alignment. Figure 27.4A is an alignment of hypothetical homologous genes without gaps. Note how the bases in the columns are not highly conserved. The addition of gaps in Figure 27.4B changes this, with each column containing only a single base. If the complete history of all insertions and deletions were known, the gaps in the alignments could be placed easily to make all of the homologous residues line up correctly. Of course, this information is not available in most cases, so the locations of the gaps must be inferred. Alignment algorithms are designed to slide sequences against each other in various ways to identify where and how large the gaps should be, a process that must be optimized for all of the sequences in an alignment, not just each pair.
Insertions and deletions are not the only complexity of sequence evolution that alignment methods need to deal with. For example, sections of an element can be moved from one end of an element to the other via some type of translocation. Sections from one element may move into the middle of another element. Inversions can make optimal alignments nonlinear. In part because of these complexities, there is an almost bewildering diversity of methods available for carrying out sequence alignments for phylogenetic analysis. Some of the different classes of approaches are reviewed here, including those that focus only on primary sequence and those that attempt to use secondary or tertiary structure information as a guide. Note that these same approaches are used in performing database searches as discussed in the previous section.
Alignment by Primary Sequence—Approach I: Comparing Sequences without External Information
The most commonly used approach to multiple sequence alignment is to make use only of the primary sequence information in the elements being aligned. In such methods, it is common to use what is known as a progressive approach, wherein a pair of sequences is first aligned to each other (with gaps inserted where necessary in the two sequences) and this alignment is then “locked.” Next, either another sequence is aligned to this locked pair or a new pair of sequences is aligned to each other (again with gaps inserted where necessary). This procedure continues until all of the homologous sequences have been aligned. Because the order in which the sequences are aligned can significantly affect the results, a variety of methods for determining this order have been developed, with most using some scoring scheme to identify and then align the most similar sequences first and then the next most similar pair, and so on.
The actual step of aligning two sequences or sets of sequences to each other and placing gaps where needed can be done in a variety of ways. The methods to do this generally can be divided into two classes: global and local. Global alignment methods attempt to optimize the alignment over the entire length of each sequence or set of sequences. Local alignment methods search for smaller sections of similarity that do not necessarily encompass the entire length of the sequences and then link together multiple small local alignments into a larger alignment. One local alignment method, Basic Local Alignment Search Tool (BLAST), is commonly used in database searches and is described in more detail in Box 27.1. In both local and global alignments, it is necessary to assign scores to the “match” between two sequences to identify the optimal alignments. These scores are assigned using matrices similar to those described in Box 27.1.
Box 27.1 BLAST Searching
The most commonly used method of database searching is to start with a sequence of interest (known as the query sequence) and search in the database for similar sequences. Such searches are frequently carried out using the algorithm known as BLAST (Basic Local Alignment Search Tool). We outline the key steps in this method below.
Step 1. Breaking Sequences into Words and Searching for Word Matches
In the first step, BLAST chops both the query sequence and the database sequences into short sequence segments known as “words.” The length of words that are used can be varied. For each word in the query, a list of similar words is made in the following way. First, the word is aligned to other possibly similar words. Then, the residues in each position of the alignment are compared and a score is given based on a substitution matrix that is a table of scores for all possible pairs of residues. Next, the score is summed across the entire word alignment, and if the score exceeds some threshold, the word is considered to be similar to the word in the query (Fig. 27.5).
For DNA word comparisons, a simple matrix is usually used with a +1 score given when the two words have the same nucleotide and a 0 score given when two words have a different nucleotide (Table 27.3). The comparison of protein words is essentially the same as for DNA. However, the scoring matrices for amino acid sequences in proteins are more complex because they are 20 × 20 matrices (Fig. 27.6). Furthermore, the scores can be generated in two ways. One method, based on the score on the chemical similarity of various amino acids, assigns positive scores to similar amino acids and negative scores to dissimilar amino acids—a method that penalizes positions where the query and database sequences are chemically different. An alternative method, based on comparisons of known protein sequences, acknowledges the differing probabilities of different amino acid substitutions over evolutionary time. This method assigns a positive score to the common substitutions and a negative score to the rare substitutions. An example of such a matrix is shown in Figure 27.6. The values range from negative to positive and, as with the DNA-based scoring outlined above, a higher score implies a better match. Thus, with either method, similarity of protein sequences is based not only on the total number of differences between them, but also on how likely it is that the substitutions would affect protein function.
Using the scoring methods outlined above, a list of similar words is made for all words in the query sequence. The database is then scanned for the presence of any of these words, which can be done very quickly and efficiently. A key aspect of the algorithm is that the word length, the substitution matrix, and the score cutoff threshold for word similarity can all be varied to generate different lists of similar words to search for in the database. This splitting of query sequences into words and searching just for the presence of similar words in the database allow the BLAST algorithm to carry out comparisons between DNA and protein sequences and vice versa. For example, if one had a protein sequence and wanted to know if there was a sequence in a DNA database that could encode a similar protein sequence, the tblastn version of BLAST would be used. This program takes the DNA database and translates it in all six reading frames and creates a peptide database. Then, it takes the protein sequence, breaks it up into amino acid words, and searches for similar words in the translated database.
Step 2. Word Alignment Extension
When similar words are found, the algorithm tries to extend the length of the match between the query sequence and the database sequence by generating a longer alignment between them. This alignment will be extended as long as the matching score stays above a user-specified threshold. Extension scoring is usually done with the same type of matrices as were used for the original word matching. However, sometimes gaps are allowed and these also need to be given a score. This alignment extension is repeated for all the word matches and the extended alignments are then ranked. Several ranking methods are available. For example, they can be ordered by the total alignment score or they can be given a significance value (given as an E value that represents the expected chance that one would see such a match in a random database of the same size).
Step 3. Setting Cutoff Thresholds
The BLAST algorithm can output alignments between the query sequence and sequences in the searched database and can assign them scores. However, it cannot identify which alignments are relevant to the question at hand. How is that determined? The method, of course, depends on the particular question being asked. If the study is focused on closely related homologous sequences, a stringent cutoff can be set for either the E value or the total alignment score. If more distantly related sequences are included in the analysis, then a less-stringent cutoff should be used. As discussed above, it is critical to remember that similarity is not proof of homology.
Alignment by Primary Sequence—Approach II: Using Prior Alignments as a Guide
Often, a gene family or sequence element of interest has been studied previously, and thus prior information is available that could aid in making alignments with new family members. One way to use this prior information is to use a prior alignment as a “seed” for aligning new sequences. An alternative approach is to use the prior alignment to make a model of the sequence patterns seen in the family and then align new sequences to this model. This method could be used both for generating a new multiple sequence alignment and for searching a database for new members of the gene family of interest.
A variety of methods are available for creating such models of gene families or sequence elements. One approach is to take a prior alignment and determine the most frequent nucleotide or amino acid in each column and then use these to create a consensus sequence for the family. New sequences can then be rapidly aligned to that consensus sequence using BLAST, for example. A more refined variation uses all of the information in the prior alignment to create a model of the probabilities for each nucleotide or amino acid for each column. New sequences are then aligned to the model and a probability that the sequence matches the model can be calculated. One example of this probability-based alignment is the use of protein family hidden Markov models (HMMs) (Fig. 27.7).
Structure-guided Alignments Are Sometimes Needed
In some cases, the primary sequence of genes or elements of interest is so poorly conserved that it cannot be used to make alignments. In these cases, it is sometimes possible to make robust alignments by using structural information as a guide. For example, secondary structure is highly conserved for rRNA genes, even when the primary sequence is not. Thus, alignment of the primary sequence can be guided by the corresponding position within the secondary structure (Fig. 27.8). Similarly, alignment of distantly related protein sequences can be guided by the protein’s known or predicted secondary or tertiary structure. In such cases, a modeling program is often used to test the fit of a particular sequence against a known two- or three-dimensional structure—a process known as threading. When completed, the positions in two- or three-dimensional space can be used to back-calculate a primary sequence alignment.
Alignments Represent a Hypothesis
However one generates an alignment, whether it is a multiple sequence alignment or a pairwise alignment between a query and a database, it is critical to realize that alignments represent a hypothesis and not truths per se. Thus, the residues in an alignment column in a multiple sequence alignment, even if they are similar to each other, may not have all been derived from a common ancestor. For example, convergent evolution can cause unrelated sequences to be highly similar. Although the occurrence of convergent evolution is generally accepted at the level of morphology, it is frequently ignored at the molecular level even though its occurrence at this level is well established. For example, just because two proteins have similar three-dimensional structures does not mean they are actually homologous.
Alignment Complexity and Accuracy Depend on the Region(s) Being Compared
It is critical to realize that the ease with which alignments can be generated varies depending on the evolutionary distance of the elements being compared as well as the patterns of sequence evolution of those elements. For example, when comparing homologous protein-coding sequences from very closely related species, for most such genes, it may be possible to generate alignments at the DNA level (i.e., align the gene sequences themselves) without much trouble. However, alignments may be more challenging for some protein-coding genes in those same closely related species. In this case, some genes may have undergone such strong positive selection that their sequences may only barely resemble each other. When more distantly related protein-coding genes are being compared, alignments can become much more challenging. One key reason that some alignments are challenging is the occurrence of insertions and deletions mentioned above. The more insertions and deletions that have occurred, the more difficult it will be to identify homologous positions within genes.
In most of the discussion in this chapter, we have focused on alignments of gene sequences. However, there is also great interest in aligning and comparing noncoding regions (e.g., regulatory elements) within and between species. In many cases, aligning homologous noncoding regions is quite challenging because the patterns of conservation are very different from those seen for gene sequences (e.g., see pp. 545–547). This means that algorithms for alignment that have been designed to work well for gene sequences may not work well for many noncoding regions.
Methods Used to Infer Phylogenetic Trees
Once a multiple sequence alignment is in hand, a phylogenetic reconstruction method (or methods) must be chosen. The many and remarkably diverse methods can be classified into three main categories on the basis of their overall schema: parsimony, distance, and likelihood methods (Table 27.4). The following sections provide a general outline of these approaches along with a few examples of methodological variants within each category.
Parsimony Methods Are Based on the Principle of Occam’s Razor
The principle known as Occam’s (or Ockham’s) Razor states that, lacking any other factors, the simplest explanation—the most parsimonious one—should be chosen. Application of this principle to evolutionary studies has led to the development and use of “parsimony” methods for phylogenetic inference. These methods work in the following manner: Given a set of data (e.g., a multiple sequence alignment), phylogenetic trees that represent alternative possible relationships among the OTUs in the dataset are given a score. The score is a measure of the number of evolutionary changes (e.g., A changing to T) that would be required to generate the data given that particular tree. Of the possible trees, the one considered most likely to represent the true history of the OTUs is the one with the lowest score (i.e., the one requiring the fewest evolutionary changes). This is also known as the “most parsimonious tree.”
As an example, imagine that we have DNA sequences from five taxa (Fig. 27.9). In a parsimony analysis, our goal would be to generate all of the possible trees showing the relationships among the five taxa and then to determine the number of evolutionary changes that would be required to generate the sequence alignment given each of those trees. To make this very simple, just consider one alignment column (column 1) and two possible trees (Fig. 27.10A,B). For each of these trees, we need to determine how many evolutionary changes would have been required to produce the observed character states in column 1 (i.e., to fit the sequence data to the tree). This is done by overlaying the character states onto the tree and then working backward to infer the ancestral states. For example, for tree 1, first overlay the current states (Fig. 27.10C) and then ask: What is the simplest way to get these data? The simplest history of possible ancestral states requires only one change from A → G along one branch (Fig. 27.10E). It is important to realize that there are other ways to generate the data given this tree, but what we need to determine is the scenario requiring the fewest changes. For the alternative tree, the same exercise is performed. Again, overlay the characters onto the tree (Fig. 27.10D). Here, a minimum of two changes are required. One example is shown below, although there are other possible histories requiring only two changes (Fig. 27.10F). This methodology is repeated for all alignment columns to give each tree a score that represents the sum, over all alignment columns, of the minimum number of evolutionary events required to produce that tree.
The example above shows a very simple case in which the minimum number of changes required to generate particular trees can be counted. Of course, in the world of real data, further complications arise—there can be many more taxa involved and more characters. As a result, determining the minimum number of changes is not straightforward, but rather requires the use of complex computational algorithms. Even assuming that the minimum number of evolutionary changes required to fit a set of sequences to a given tree can be identified, one major complication to parsimony analysis remains: As the number of taxa goes up, the number of possible trees increases exponentially (Table 27.5). Thus, in many situations, a score cannot be given to all possible trees because there are simply too many to calculate. To overcome this computational obstacle, methods have been designed to search through this “tree space” to find the shortest tree without actually scoring all possible trees (see Box 27.2).
What we have described here is parsimony-based phylogenetic reconstruction in its simplest form. There are many variants to this, such as the use of different weighting schemes for different types of changes. All follow the same general principle of searching for the lowest-scoring tree or trees. An important aspect of such methods is to recognize that they explicitly involve inferring ancestral and derived character states, which can be of great use in studying the pattern of trait evolution.
Box 27.2 Tree Searching
Many phylogenetic methods (e.g., parsimony, likelihood, and some distance methods) identify optimal trees by assigning scores to all possible trees and then picking the “winner.” This approach has one major limitation: For many datasets, there are more possible trees than one can score. This has led to the development of algorithms that scan through the set of all possible trees for a given dataset (i.e., the tree space) and locate the tree with the best score without actually scoring all the possibilities.
Searching through tree space is similar in concept to the idea of searching through fitness landscapes described on pp. 464–466 and 472–473. Basically, the task for a computer algorithm here is to find the highest peaks on the landscape of tree scores and not get trapped in local optima when higher peaks are found elsewhere. To understand how this is done for tree searching, we give an example here for a parsimony-based scoring scheme. Note that the score could be based on other measures, such as distance or likelihood calculations.
Suppose the dataset is composed of a particular gene sequence from each of five species. Construct the first tree, at random, to represent one possibility for the phylogenetic relationships among the five species. Use a parsimony method to assign the tree a score that represents the number of DNA substitutions that would have been required to produce the gene sequences as located in this tree. Then, rearrange the tree by moving some nodes/branches and score the resultant tree. Compare the two trees and choose the one that requires the lower number of substitutions (i.e., the more parsimonious tree). Repeat this process again and again, each time performing a branch/node rearrangement, scoring the new tree, and selecting the “shorter” one.
Various methods have been developed for rearranging the nodes/branches. One, known as nearest-neighbor interchange, swaps two of the nearest neighbors within the tree (Fig. 27.11). In theory, one could identify the optimum tree by continuing to swap pairs of nearest neighbors until no shorter trees can be identified. However, this type of tree search can get stuck on a local optimum, or peak, because the method does not allow for major tree changes. For example, if a person is on the peak of a small mountain in England, all “nearest neighbors” would be downhill, and one would stop searching, thinking that the optimum had been found, without ever discovering the global optimum far away in the Himalayas. Therefore, this method needs to be complemented by others that allow searching for far-away optima, such as subtree pruning and regrafting (Fig. 27.12). In such methods, a branch along with all of its subbranches is moved from one location on a tree to another spot on the same tree, thus enlarging the searched space. The scores are then compared between the two trees and the tree with the better score is selected as the next starting point.
These are but two examples of the many different tree-searching methods. The basic idea shared by most approaches is to combine multiple methods so that one not only can climb to the top of a local peak but can also locate other peaks in the distance that might be higher still.
Distance Methods Use the Evolutionary Distance between OTUs to Infer Phylogenetic History
As discussed above, the concept of descent with modification tells us that organisms sharing a recent common ancestor should, on average, be more similar to each other than organisms whose last common ancestor was more ancient. Therefore, it should be possible to infer evolutionary relationships from the patterns of similarity among organisms. This is the principle that underlies the various distance methods of phylogenetic reconstruction, all of which follow the same general outline. First, a distance matrix (i.e., a table of “evolutionary distances” between each pair of taxa) is generated. In the simplest case, the distances represent the dissimilarity between each pair of taxa (mathematically, they are 1 – S, where S is the similarity). The resultant matrix is then used to generate a phylogenetic tree.
To explain how distance methods work, assume initially that the real history of the taxa is known and that their relationships can represented in the form of a tree where the branch lengths represent the evolutionary distances between nodes (see, e.g., Fig. 27.13). (Later, we return to how distances are calculated from data such as those from a multiple sequence alignment.) Given such a tree, we can calculate the distances between all of the OTUs (the values needed for a distance matrix) by simply summing the lengths of the branches that connect them and thus generate a distance matrix (Table 27.6).
Working in the opposite direction, starting with the distance matrix, how can the tree be inferred? One approach would be to mimic the parsimony methods outlined above, compare different trees to each other, and give each a score based on some analysis of the distance matrix in comparison to the tree. One such method, known as the least-squares method, gives each tree a score in the following way. For each tree, branch lengths are calculated by attempting to minimize the least-squares difference (LSD) between the distance matrix and the branches. The LSD is the sum of all squares of all (Dm – Dt), where Dm is the distance in the matrix and Dt is the distance in the tree. Then, using tree-searching algorithms akin to those in Box 27.2, the tree with the lowest LSD can be found. An alternative method, known as minimum evolution, uses the LSD calculation to assign branch lengths to each tree, but then searches for the tree that has the shortest total sum of all the branch lengths.
Although it has been shown that searching for the optimal distance tree using these methods can be powerful, such searches have many of the same limitations as parsimony methods (e.g., low efficiency due to the need to scan through tree space). Fortunately, another alternative method calculates a tree directly from a distance matrix using an algorithm. Such algorithmic approaches are remarkably fast because they do not require one to scan through tree space. Two examples of distance-based algorithms, the unweighted pair group method with arithmetic mean (UPGMA) and neighbor joining, are described in Box 27.3.
Box 27.3 UPGMA and Neighbor-Joining Methods
UPGMA
One algorithm for inferring a tree from a distance matrix is a progressive clustering method (much like those used for sequence alignment described above) known as the unweighted pair group method with arithmetic mean (UPGMA) algorithm. This method constructs a tree by identifying the shortest distance (D) in the matrix, clustering those two taxa into a single OTU for use in all subsequent calculations, calculating a new distance matrix, and then repeating these steps. The following example illustrates in more detail how UPGMA works.
Suppose that six OTUs (species in this example) are related by the tree in Figure 27.13. The numbers on the tree correspond to the evolutionary distances separating each species. A distance matrix for these species can be determined by simply summing up the numbers on the branches connecting each pair of OTUs (Table 27.6). Note that the matrix is symmetrical about a diagonal axis because the distance from, for example, A to B is the same as the distance from B to A. Thus, such matrices are frequently simplified to show only the values on one side of the diagonal (Table 27.7). The UPGMA algorithm converts this distance matrix data into a tree in a series of steps:
-
The pair of OTUs with the shortest pairwise distance is selected (i.e., A and B in this example). A subtree is then drawn for A and B with the branch length between them equal to 2 (Fig. 27.14).
-
This subtree is refined by positioning A and B as the tips and placing the node between them at the midpoint (e.g., 0.5 × 2 = 1) (Fig. 27.15). Note that by placing the node at the midpoint between the two groups, the UPGMA method implicitly assumes that the rate of change has been the same in each lineage since they diverged from a common ancestor. This assumption is invalid in many, if not most, cases and is one of the biggest limitations of the UPGMA method (discussed further below).
-
These two OTUs are merged and treated as one (AB). A new distance matrix is generated where the distance between each OTU and AB (Dx,AB ) is calculated as the average of the original distance from that OTU to A (Dx,A) and its original distance to B (Dx,B):
Dx,AB = 0.5 × (Dx,A + Dx,B).
-
The new distance matrix in this case would be that in Table 27.8.
-
These and the subsequent steps are summarized in Table 27.9 below.
One of the great advantages of UPGMA is that it is very fast. However, with speed comes some inaccuracy. Perhaps most critical is the assumption that evolution has been clocklike (i.e., that the rates of evolutionary change are uniform in different evolutionary branches). Given this clocklike constancy, then all of the tips in a tree must be equidistant from the root of the tree. Such a tree is called an ultrameric tree. In mathematical terms, this means that for any three OTUs (e.g., A, B, and C), the distance between any two (e.g., AC) is always less than or equal to the maximum distance between the other two (AB and BC):
DAC ≤ max(DAB, DBC).
This is illustrated in the tree in Figure 27.16. Looking at DAC, for example, we see that it passes the test because DAC = 6 and max(DAB, DBC) = 6. Likewise, all of the other possible OTU pairs also meet this criterion.
Although it would be nice if all evolutionary distances met this ultrameric criterion, this is not the case. For example, if the rate of evolution is not the same in all branches, as in the tree in Figure 27.17, the ultrameric criterion is not met for at least one pair of OTUs—for BC, in this case. Because DBC = 6 and the max of (DAB, DAC) is 4.5, DBC > max(DAB, DAC). When the ultrameric criterion is not met, UPGMA will return an incorrect tree. A more detailed example of this error is given in Table 27.10.
Neighbor Joining
Many other distance algorithms have been created that attempt to infer trees accurately, even in the face of the vagaries of evolution such as the unequal rates problem outlined in the discussion of UPGMA above. We consider here one example of an alternative method—neighbor joining. This method resembles the UPGMA clustering method but has some unique properties. Most importantly, it allows for unequal rates of evolution in different branches of the tree. Furthermore, if the distance matrix is an accurate reflection of the real tree, neighbor joining will always infer the true tree. Neighbor joining works in the following way.
Step 1. Generate a distance matrix. (For now, as with UPGMA, we assume this is given. In the next section we discuss how these are made.)
Step 2. Assume an ambiguous tree with all of the OTUs in the matrix branching from a single central node, thus forming a star-like pattern (see Table 27.11).
Step 3. For each OTU, calculate a measure (S) as follows: S is the sum of the distances (D) between that OTU and every other OTU, divided by N – 2, where N is the total number of OTUs.
Step 4. Calculate the distance Dij between each OTU pair (e.g., I and J).
Step 5. Identify the pair of OTUs with the minimum value of Dij – Si – Sj.
Step 6. As in UPGMA, join these two taxa at a node in a subtree.
Step 7. Calculate branch lengths. Unlike UPGMA, neighbor joining does not force the branch lengths from node X to I (Dxi) and to J (Dxj) to be equal (i.e., it does not force the rate of change in those branches to be equal). Instead, these distances are calculated according to the following formulas:
Dxi = (1/2) Dij + (1/2) (Si – Sj),
Dxj = (1/2) Dij + (1/2) (Sj – Si).
Step 8. Calculate a new distance matrix with I and J merged and replaced by the node (X) that joins them. Calculate the distances from this node to the other tips (K) by
Dxk = (Dik + Djk – Dij)/2.
Step 9. Repeat.
A detailed example is given in Table 27.11 in which the same tree as in Table 27.10 is used.
For Distance Methods, Corrections Are Essential to Convert Measures of Similarity to Evolutionary Distances
So far, we have assumed that one is given an evolutionary distance matrix to use in a distance-based inference. Of course, this is not how it works. Instead, one needs to generate a distance matrix from some comparison of the OTUs in question. Here, we discuss how such matrices are made from sequence alignments.
In the simplest case, a distance matrix is made directly from measures of the identity of different sequences, where the distance is a measure of the difference (D) between two sequences (I and J) in an alignment. In this case, the difference is calculated as 1 – percent identity (I). That is, Dij = 1 – Iij.
This difference-based distance, however, is imperfect for most applications because, in most cases, distance-based reconstruction methods assume that the D used in the distance matrix is a measure of the total extent of evolutionary separation between lineages, also known as an evolutionary distance (which we refer to here as d). One reason that the difference-based D is not necessarily a good approximation of d is that percent identity does not take into account all of the information available in a sequence alignment. For example, in protein sequence alignments, using percent identity would give the same value when two sequences have similar amino acids (e.g., valine [V] in one and isoleucine [I] in another; both of these are small hydrophobic amino acids) as when they have very different amino acids (e.g., aspartic acid [D] in one and tryptophan [W] in another). In most cases, one would consider a change between V and I to count less than a change between D and W. Thus, many distance calculation methods try to take this into account. One way to do this is simply to group amino acids by their chemical similarity and then calculate similarity (S) scores, rather than identity scores. An alternative way of calculating similarity scores is to use information on the actual probability of changing between two amino acids in known proteins (see Box 27.1). However S is measured, it can then be used to calculate a more robust “dissimilarity” D: Dij = 1 – Sij.
Another related issue in using the “difference” measure to fill out a distance matrix is that most measures of D do not scale linearly with any discrete measure of evolutionary separation, such as time or number of generations. For example, consider a case where one runs a computer simulation of two DNA sequences evolving and diverging over time where the rate of change is kept completely uniform. If the percent difference versus time is plotted, the results are something like those seen in Figure 27.18 with an asymptotic percent difference. As one gets further and further separated in time, the amount of change per unit time decreases. Or, in other words, the relationship between percent dissimilarity and time is not linear as more time elapses. A true evolutionary distance (d), one that would be most useful for phylogenetic inference, should be more linear.
The nonlinearity described above is due to the discrete size and number of possible character states found in DNA sequences. Because there are only four possible states and a limited number of sites, as more time elapses, the probability increases that a specific site will be hit by multiple changes. For example, if, in generation 10, site 20 in a sequence changed from A to T, and then, in generation 200, the site changed from T to C, when the two sequences at this site are compared, there could be no increase in their difference after the first change; that is, the second change does not contribute to the dissimilarity. Note that this is true whether the second change occurs in the same lineage with the original change or in the lineage to which this sequence is being compared. Either way, there are “multiple hits” for a single site.
A simple correction for this was made by T.H. Jukes and C.R. Cantor, where they showed that a more robust evolutionary distance can be calculated from percent difference
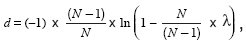
where λ is the percent difference, N is the number of character states, and D is the corrected evolutionary distance. Thus, for DNA sequences the formula is
D = (–3/4) × ln(1 – (4/3) × λ),
and the formula for amino acid sequences is
D = (–19/20) × ln(1 – (20/19) × λ).
The Jukes–Cantor correction is designed for situations where rates of all types of changes are uniform. However, that is not always the case. For example, in most types of genes, DNA transitions occur at a higher rate than DNA transitions (see Chapter 12). Thus, to calculate an evolutionary distance in such situations, the “Kimura-2 parameter” distance correction, which allows for two discrete types of changes in the calculation of the distance, can be used. These are the two simplest distance correction methods. Other more elaborate and sometimes more useful ones have been developed, but for our purpose here the important thing is that corrections are needed. It is important to realize that the models used to make these distance corrections are also useful in other phylogenetic and sequence analyses. For example, one can use the Jukes–Cantor or Kimura-2 parameter calculations to score sequence alignments. In addition, they can be used to assign weighted parsimony scores and for the models used in likelihood-based phylogenetic analysis (see next section).
A general problem for the Jukes–Cantor and Kimura-2 parameter corrections, as well as many others, is that they assume base composition or amino acid composition is uniform and stationary over time. When this is not the case, these methods can produce distance matrices that lead to incorrect tree inference. One method that corrects for this is the LogDet distance correction approach (see later section on Variable Rates and Patterns).
One of the great advantages of distance-based phylogenetic reconstruction methods is that they can be applied to diverse types of comparative biological data. As long the distances between taxa can be calculated, these distances can be fed into a tree-building algorithm. However, this is not always good. Just because a distance can be calculated does not mean that it is useful. For example, a distance matrix could be built based on the difference in height between animal species. If this matrix were fed into a tree-building algorithm, the resulting tree would group mice and small lizards together and giraffes and elephants together. This nonsense results because similarities and differences in height do not correspond to evolutionary distance no matter what correction is used. Nevertheless, if the right types of data are used, distance methods can be a very powerful tool in phylogenetic analysis.
Likelihood and Bayesian Approaches Are More Statistical Than the Other Methods
One limitation of both the distance and parsimony methods is that although they may select one tree over another on the basis of some criterion, it is not possible to say how much more probable one tree is than another. Likelihood and Bayesian methods have been designed to provide such a statistical framework for phylogenetic reconstruction.
To understand how likelihood-based phylogenetic methods work, it is useful to consider the concept of likelihood in a statistical sense. This is discussed in more detail in Chapter 28. For our purposes here, the important concepts can be understood by considering a simple example involving coin tossing. Suppose we were able to make some observations of the tossing of a coin and we wished to test whether the coin was “fair” (i.e., that it had an equal probability of yielding heads or tails). The observations would be considered our data, or D. Suppose we wanted to test two possibilities: hypothesis H1 that the coin is fair and has an equal probability of yielding heads or tails, and hypothesis H2 that the coin is biased toward heads by a 60:40 ratio. We need to determine what the probability is that the hypothesis explains the data, or in other words, what the probability of the hypothesis is, given the data. This can be written as Prob(H|D).
Using this concept of conditional probability, the probability of a hypothesis given the data equals the joint probability of the hypothesis and the data divided by the probability of the data. This is represented in Bayes theorem as
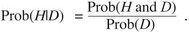
|
(1) |
The joint probability term (Prob(H and D)) is equivalent to the probability of the data given the hypothesis (Prob(D|H)) times the probability of the hypothesis (Prob(H)). Thus, Equation 1 can be rewritten as
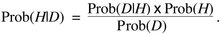
|
(2) |
Next, a ratio is calculated that compares the probability of hypothesis 1 given the data to the probability of hypothesis 2 given the data by simply replacing H with H1 or H2 and taking a ratio:
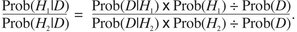
|
(3) |
The Prob(D) can then be canceled out to produce
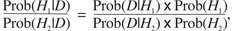
|
(4) |
which can be rearranged to
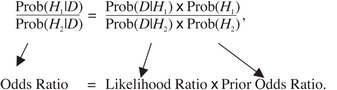
|
(5) |
The goal in the coin-tossing test is to determine the left portion of this equation, which is known as the posterior odds ratio or just the odds ratio of the two hypotheses. Unfortunately, this calculation is not usually possible because it requires knowledge of the ratio of the probabilities of the two hypotheses (the prior odds, the far right term in the equation) prior to making any observations. Without prior information, we cannot know this. Fortunately, there is one portion of the equation that we can calculate—the likelihood ratio—which is the ratio of the probabilities for the data given each hypothesis. The probability of a particular dataset, given a hypothesis, is known as the likelihood (L) of the hypothesis. These likelihoods are the values calculated by maximum likelihood phylogenetic methods.
For the coin-tossing example, it is relatively straightforward to calculate the probability of the data given each of the two hypotheses. Suppose one observed the pattern HTTTTHTHTH in ten coin flips. The likelihood of hypothesis 1 given these data would be Prob(D|H1) = Prob(HTTTTHTHTH|H1). To calculate this, simply use the probability of heads or tails from the hypothesis and multiply this out replacing the H or T with that probability. In hypothesis 1, each is 0.5, so L1 = (1/2)10 = 1/1024 = 0.0009765625. Do the same calculation for hypothesis 2, replacing H with 0.6 and T with 0.4. L2 = 0.0005308416. Although both of these numbers are low, L1 > L2 and thus H1 would be favored over H2.
When the concept of calculating likelihood scores is applied to phylogenetic analysis, the hypotheses are the different trees and the data are the observed character traits. Thus, L = Prob(D|Tree). A detailed explanation of how to calculate L for phylogenetic trees is beyond the scope of this book (see Web Notes. When working from sequence alignments, L is calculated for a tree by calculating subcomponents of L for each site in the alignment and then summing these subcomponents for all sites. To do this, an explicit model of how the character states change in multiple sequence alignments (i.e., a model of the probability of different nucleotide or amino acid substitutions) is needed.
For example, the observation (see Chapter 12) that DNA transitions (changes from purine to purine or pyrimidine to pyrimidine) usually occur more frequently than transversions (changes from purine to pyrimidine and vice versa) could be taken into account. To do this using a likelihood method, a 4 × 4 matrix is created with probabilities of change (in essence a rate parameter) assigned to each cell in the matrix (Table 27.12). This matrix is used in basically the same way as the scoring matrices for the database searches, alignments, and distance corrections used above, except that the values in the matrix are probabilities of change, rather than specific scores. Once such a rate matrix has been obtained, the probability that the data would be generated given a particular tree can be calculated. Other strategies that take into account variation in the rate of change are discussed in the section Issues in Phylogenetic Reconstruction because they are useful in distance and parsimony methods.
One significant consequence of incorporating probabilities of change in this method is that accurate calculation of likelihood scores now requires knowing not only the branching pattern of a tree but also the branch lengths. In contrast, parsimony methods simply count changes and use that data to calculate the branch lengths. Likewise, distance methods use strategies to calculate branch lengths from the dissimilarity data. In most cases, it would be too computationally costly to search through all trees and all possible branch lengths of trees. Therefore, likelihood methods frequently calculate branch lengths using an alternative method such as a distance algorithm and then use those branch lengths in the calculation of L.
Likelihood phylogenetic reconstruction methods resemble parsimony methods in that different trees are compared and given a score. They differ significantly in that their tree scores are likelihood values. The “best” tree is identified as the one that has the highest probability of producing the observed character data, assuming a particular model of how characters change over time. For both likelihood and parsimony methods, searching through tree space becomes computationally intense and the number of possible trees may be too large to evaluate them all.
Recently, an interesting and powerful offshoot of likelihood methods that has become more commonly used is the group of “Bayesian” phylogenetic reconstruction methods. These methods attempt to calculate a different portion of the likelihood equations shown above: the posterior probability (Prob(H|D) in Equations 1–4). Thus, rather than trying to calculate the probability that a particular hypothesis could generate the data, Bayesian methods seek to calculate the actual probability of the hypothesis by attempting to assign a value to the prior odds term of the equation.
As in the discussion of likelihood phylogenetic analysis above, the hypothesis here is a particular tree and the data we consider is a sequence alignment. Also, as in likelihood methods, the hypotheses are tested using particular models of sequence evolution. Bayesian methods can make use of the same models of DNA substitution used for likelihood analyses.
One challenge for Bayesian methods is that they need to specify the priors—the probability of the data and the probability of the hypothesis. Another challenge is that the posterior probability cannot be calculated analytically because a full solution requires one to make calculations across multiple parameters and all possible trees. Currently, the way the posterior probability is solved is by using what are known as Markov chain Monte Carlo (MCMC) simulations to scan through tree and parameter space. A significant advantage of Bayesian MCMC methods is that they can be used to calculate posterior probabilities of particular groups in a tree much like bootstrapping (see later section) would be used for other phylogenetic methods. Although posterior probabilities are not equivalent to bootstrap values, they do indicate some measure of the support for a particular phylogenetic grouping. Most importantly, posterior probabilities can be calculated much more rapidly for large data sets than bootstrap values can be calculated for likelihood analyses.
A very powerful use of likelihood and Bayesian methods is that they allow for testing of a variety of evolutionary hypotheses within a statistical framework. For example, if one were confident in the accuracy of a particular evolutionary tree, one could then ask: Given this tree, what models of sequence evolution best fit the data to the tree?
Evaluation of Methods and Trees
Tree Reconstruction Methods Can Be Evaluated Objectively
Each method used to construct phylogenetic trees has its advantages and disadvantages. Some researchers favor one method over another on principle. For example, some advocate parsimony methods out of respect for the principle of Occam’s Razor, whereas others prefer the statistically based likelihood methods. Distance methods are valued for their ability to use any type of data easily. However, these methods differ not only in philosophy, but also fundamentally in their results. An extensive analysis of the pluses and minuses of each method is beyond the scope of this chapter. Here, we discuss some of the approaches that are used to evaluate various tree construction methods and the trees they produce.
One practical criterion for evaluating methods is efficiency (i.e., how fast each method performs). Even though computers become ever faster, efficiency remains a major concern because some of these methods are very computationally demanding. Both parsimony and likelihood methods must scan through tree space; thus, they take much longer to process the same dataset than a distance method would. Likelihood methods are often slower yet due to their typically more complex calculations.
Another vitally important criterion is whether, given sufficient data, the method will reliably generate the correct tree (i.e., its consistency). An inconsistent method will frequently produce the wrong tree even if given infinite amounts of data. A third criterion turns this around and asks how much data are required to produce a particular probability of getting the correct result (i.e., the method’s power). Thus, both power and consistency are measures of how much data a method requires to produce correct results.
All phylogenetic methods make assumptions about the evolutionary processes that underlie the character changes being studied. Because the accuracy of these assumptions is not always known, methods are also evaluated by comparing their degree of dependency on these assumptions (i.e., their robustness). A fifth and related criterion is the method’s falsifiability (i.e., whether or not the results produced will allow us to determine if the underlying evolutionary assumptions have been violated). This is especially important for methods that are not very robust.
Phylogenetic Methods Can Be Tested Using Datasets with Known Histories
How are the consistency, power, and robustness of various methods determined? The best way is to gather datasets with known evolutionary histories and then evaluate the ability of the different methods to construct accurate trees from the data. The results of such tests are very informative. Where can such datasets be obtained? There are three main sources: in silico computer simulations, in vitro lab simulations, and “real” data with known history. We provide a few examples of these approaches in this section.
As we discussed earlier, the UPGMA method, in theory, should not perform as well as neighbor joining when the rates of evolutionary change are not uniform in all evolutionary branches. This prediction can be readily tested in silico using computer simulations to create trees with different rates of change for different branches. We start with a gene sequence at the root of the tree and evolve the sequence to produce a tree with the desired properties. Through such testing, not only does UPGMA generally not perform as well as neighbor joining under these conditions, but, most importantly, UPGMA is also inconsistent in that it gives the wrong tree no matter how many characters are included in the analysis.
This inability of UPGMA to handle varying rates effectively was readily predictable from its methodology alone. Many less obvious problems have been revealed in large part through computer simulations. For example, recall from Chapter 5 (p. 130) that long-branch attraction (LBA) is a phenomenon in which phylogenetic reconstruction methods group together OTUs that are at the end of long branches, whether or not the grouping is actually warranted by their relatedness. An example of this is shown in Figure 27.19.
Simulations have shown that all known phylogenetic reconstruction methods are prone to distortion by LBA. The underlying culprit here is homoplasy: the creation of identical character states by separate evolutionary events. Homoplasy can occur during either parallel or convergent evolution. Simulations have shown that if the dataset we are studying has two nonsister OTUs at the end of long branches, we will observe more homoplasy between those taxa than expected. This occurs because the longer the branches, the more evolutionary changes, and thus the higher the probability that some characters (e.g., sites in their gene sequences) will change to the identical character state (Fig. 27.20). Furthermore, simulations have revealed that all methods are subject to errors from LBA.
Using other approaches, computer simulations can also test the robustness of particular methods (i.e., how well the method performs when its underlying assumptions are not met). For example, one can ask how well a likelihood method performs when the simulated data were generated using an evolutionary pattern different from that used in the likelihood reconstruction.
Of course, the use of computer simulations for testing can be criticized because situations that may never occur in nature are being tested. To counter this, in vitro simulations have been developed in which real organisms are forced to evolve with particular branching patterns. Data are gathered from the resultant organisms and then used to test phylogenetic reconstruction methods. This approach has the advantages of allowing for many of the vagaries of biological systems and real data collection, as well as enabling the testing of performance on data with specific phylogenetic branching patterns. In vitro simulations have been done with many biological samples, most commonly with bacteria and/or their viruses. Slightly more controlled simulations have been performed using in vitro gene evolution as discussed on pp. 102–103 and 458–460. In both cases, these in vitro simulations that involve some level of “real” biology are an important complement to in silico testing.
It is also possible to test phylogenetic methods using data collected from nonsimulated situations if there is extreme confidence that the underlying tree for the organisms is known. This requirement can be met by using breeds of domesticated animals or plants for which the history is known very accurately.
Phylogenetic Reconstructions Can Be Assessed in Several Ways
When the true evolutionary history is not known, a variety of tests can be used to assess the results of a phylogenetic reconstruction method. One important question to ask in this regard is When the method has selected the ideal tree for a dataset, how well does that tree represent all of the underlying data? This is an important question because all phylogenetic reconstruction methods will output a tree or a few select trees. It is possible that such trees exhibit all of the underlying data perfectly, or they could simply be an average of multiple conflicting datasets. For example, imagine that the dataset includes a multiple sequence alignment in which the right half has one history and the left half has another. This could be due to recombination or gene transfer or artifacts of data collection, for example. A phylogenetic tree generated from these data might not represent the history of either the left half or right half well. Thus, methods for determining how well a particular tree represents the data in hand are needed. In the following sections we discuss some of the common approaches used to assess how well particular trees represent the underlying data.
One approach to assessing how well a tree represents all of the data is to resample the data repeatedly and reperform the phylogenetic analysis to see how often the same result is obtained from these resampled (and nonidentical) datasets. Resampling can be done by bootstrapping in which the characters (e.g., alignment columns) are resampled with replacement, or by jackknifing, in which the characters are resampled without replacement (Fig. 27.21). Frequently, 100 or 1000 of these new resampled datasets are generated and a phylogenetic tree is built from each of them. The new trees are then compared to determine in what fraction of the trees particular evolutionary groupings are found. It is very important to realize that these tests do not determine how accurate a tree is, just how well it reflects the underlying data. If the data are biased in some way (e.g., there has been significant convergent evolution), the result can be high bootstrap or jackknife support for an incorrect tree.
Another strategy for detecting discrepancies in the underlying data is to compare the tree generated based on all characters with the trees produced by analysis of each character separately. The most straightforward way of doing this is to use parsimony methods. First, generate the actual tree from all of the data available. Next, determine the number of parsimony steps required for the first character based on that actual tree (i.e., the “actual steps”). Then, generate a tree based on just the data for that first character and determine the number of parsimony steps required in this tree. Because this second tree is optimized for the first character, the number of parsimony steps would be the “minimum possible steps.” Calculate the consistency index for that character as the ratio of those two numbers: minimum possible steps divided by actual steps. A ratio of 1 would indicate a perfect fit. The value of the ratio approaches zero asymptotically as the fit diminishes. This ratio would be determined for all characters in the dataset (Fig. 27.22).
A third approach to assessing phylogenetic inferences is that one can compare the trees generated with different methods and ask how similar they are to each other (i.e., one can test their congruency). To measure congruency, one could determine which parts of the trees agree with each other and which parts differ, or one could score the number of differences in tree branching (Fig. 27.23).
Issues in Phylogenetic Reconstruction
In addition to the tree-specific factors described above, a number of issues must be considered when performing any phylogenetic reconstruction.
The Root of a Tree Can Be Determined Using an Outgroup
A key step in phylogenetic reconstruction is determining the root of a tree. This is an important step for many reasons. For example, to infer ancestral traits for nodes on a tree (see Chapter 5), it is important to know where the root of the tree is, which in turn allows a full assessment of the direction of change. This is not possible in an unrooted tree because the ancestral node could then be placed anywhere on the tree. Rooting also allows one to determine which groups are monophyletic (i.e., are composed of the most recent common ancestor of all members of the group plus all of the descendants of that common ancestor, excluding all other taxa).
Here, we describe two methods commonly used to root trees. The simpler, although frequently less accurate, way to root a tree is known as midpoint rooting. It defines the root as the center of mass of the branches and locates it roughly equidistant from all of the tips. Although this method is useful when there is no other way to root the tree, it can lead to wildly inaccurate rootings unless the taxa being studied all evolved in a clocklike manner.
The second method is more accurate, but it is not always possible to use because it requires an outgroup, a taxon that diverged from the tree prior to the existence of the last common ancestor of all of the other taxa being studied (which are known as the ingroup). Outgroups allow one to root the ingroup tree. For example, suppose that the relationships between four species are known, as shown in this unrooted tree in Figure 27.24. If species 3 were determined to be the outgroup, the tree could be rooted by extracting species 3 (the outgroup) and connecting it to the others (the ingroup) via the root.
The biggest problem associated with outgroup rooting lies in identifying an outgroup and then gathering the information that is needed for the tree-building analysis. Perhaps the best example of how difficult this can be is seen in studies of the early evolution of life (Chapter 4). To determine the order of branching among archaea, bacteria, and eukaryotes, the tree of life must be rooted. However, there is no outgroup for this ingroup because such an outgroup would have to be from “The Fourth Domain”—a group of species that separated from the tree prior to the existence of the last common universal ancestor (LUCA). Because no such fourth domain is known, an outgroup cannot be used to root the archaea–bacteria–eukaryote tree. Interestingly, as discussed on pages 126–129, it is possible to root this tree using duplicated genes.
It Is Important to Account for Variable Rates and Patterns of Evolution
Some instances of nonuniform evolutionary rates were discussed above, including their impact on phylogenetic reconstructions. For example, the examination of UPGMA and LBA showed how rates of evolution can vary between different branches in a tree. The explanation of likelihood methods illustrated how accounting for different rates of transitions and transversions can be useful when assigning likelihood scores to different trees. In principle, there seem to be nearly an infinite number of factors that could cause evolutionary rates to vary. This section discusses some of the most important factors that need to be taken into account.
Different Types of Substitutions
It is a nearly universal feature of evolution that when there are multiple possible states for a given character, not all possible changes occur with equal probability. Although it is not possible to take into account all of the possible variations in rates of change, it is important to identify the most significant ones and account for these by building and then using a substitution matrix.
When performing phylogenetic reconstruction from gene sequences, there are two steps where these adjustments can be readily applied. The first step is during the alignment, where the different probabilities for various nucleotide substitutions can be considered when identifying homologs or making multiple sequence alignments. The second step is when making phylogenetic inferences. Thus, the procedure varies depending on the reconstruction method used. For likelihood methods, the model can be adjusted. For distance methods, adjustments can be made when calculating distances from the data. For parsimony methods, different scores can be assigned to different types of changes.
Different Nucleotide or Amino Acid Composition
One major challenge in phylogenetic analysis of sequences is that the frequency of particular nucleotides or amino acids is not uniform. For example, the average G + C content of DNA varies significantly between species, with some having as low as 15% G + C and others above 75%. There is also significant variation within genomes (e.g., in GC isochors in vertebrates). The same type of phenomenon is seen when the amino acid composition of proteins is compared. In many cases, the exact reasons for the variation between and within species are not known. Whatever the cause, there is a significant effect on phylogenetic analysis in that it can lead to more homoplasy than expected. For example, consider two distantly related organisms, each with a G + C content of 50%. Suppose further that they separately then change their average G + C content to 20%. When this occurs, which is common, what one usually sees is that most of the G + C content changes are focused in less constrained regions of the genome (e.g., pseudogenes, introns, and third positions in codons). Some changes also occur, even in what one might consider highly constrained regions of the genome. If a phylogenetic analysis were attempted including these organisms, the result would be these organisms being pulled toward each other in the trees—that is, a reconstruction would overestimate their phylogenetic relatedness.
When there are large differences in nucleotide or amino acid composition between the sequences being studied, it is thus important to try to correct for composition-driven homoplasy. In such cases, it is necessary to use methods that do not assume “stationarity”—that is, that composition is uniform between organisms. One common approach to handling nonstationarity is to use what is known as a LogDet correction for calculating evolutionary distances between pairs of sequences.
Weighting by Codon Position
Just as the rate of change can differ for different nucleotide substitutions, so, too, can the rate vary at different sites within a gene. For example, when analyzing protein-coding DNA sequences, researchers immediately noticed that the three different positions within each codon (1, 2, 3) tend to evolve at different rates, with the third position evolving much more rapidly than the others. This is primarily because the third position can often change without changing the amino acid at that position because of the degeneracy of the genetic code. Because of this, more weight might be given to changes at the first and second positions than to changes at the third positions. Although this is similar in principle to giving more weight to transversions than transitions (see above), here, instead of using a substitution matrix or the like, the different positions in the gene are differentially weighted in the phylogenetic reconstruction.
Selecting Genes for Study by Their Rate of Change
For any phylogenetic analysis, one of the most important factors influencing the choice of genes to be used for the analysis is how far back in evolutionary history to look. When studying closely related taxa (e.g., different species within a genus), recent evolutionary history is more likely to be examined, and therefore the dataset chosen must include fairly rapidly evolving characters that have undergone sufficient changes in state during this relatively brief period. Characters that change at very slow rates, such as the highly conserved rRNA genes, would not be useful. On the other end of the spectrum, when studying the relationships among bacteria, archaea, and eukaryotes in the very distant past, characters that change at moderately slow rates are required. Otherwise, any hint of similarity will probably have been erased. Thus, a balance is needed. The traits selected for study must be those that change on a timescale similar to that of the evolutionary events under study.
Should Protein or DNA Alignments Be Used?
Suppose a particular protein-coding gene was selected to be used to elucidate the evolutionary relationships among a number of taxa. Frequently, the next question is whether to analyze the amino acid sequences for that protein or the encoding DNA sequences. The ideal solution would be a rigorous analysis of the DNA, codon-by-codon, using a 64 × 64 substitution matrix to incorporate the redundancy of the genetic code in the DNA analysis. However, most of the available software tools for phylogenetic sequence analysis do not allow this option. Usually one can analyze either the DNA sequences or the protein sequences, but not a hybrid of the two.
The optimal choice depends on the level of evolutionary relationship being investigated. If closely related OTUs are being analyzed, then DNA analysis will likely be more fruitful because it allows detection of synonymous changes (changes in the DNA sequence that do not alter the amino acid sequence). If deeper evolutionary relationships are being studied, then analysis of protein sequences is more appropriate because the protein sequences change more slowly.
A related issue is whether to use DNA or protein sequences when performing multiple sequence alignments. In most cases, the answer is clear. Alignments should be done at the protein level. One exception is when there has been a DNA frameshift in one of the sequences such that the amino acid sequences now differ significantly but the underlying DNA sequences can still be aligned. If analysis of the DNA is of particular interest, then sequences should be back-aligned from the protein alignment.
Which Alignment Positions Should be Considered?
However an alignment is generated, it is important to realize that an alignment is only a model for positional homology. Just as one might be unsure as to whether certain wrist bones from humans are the same bones as those in the feet of pigs, one might be unsure as to whether a glycine at position 49 in a particular protein should be aligned with a leucine at position 50 in a homolog of that protein. Some positions in an alignment may be certain and others uncertain. One way to identify ambiguous aligned regions is to compare multiple sequence alignments generated using different parameters (e.g., substitution matrices) or different algorithms. Alignment columns that remain the same regardless of the parameter or algorithm used can be considered unambiguous. Those columns that are most ambiguous should be excluded from the analysis by using a mask (Fig. 27.25). Sequence masks are also sometimes used for other reasons. For example, some researchers routinely remove any alignment column with a gap because they question the validity of such data in phylogenetic analysis.
Using Phylogenetic Trees
The preceding sections focused on the building of trees for homologous genes. This section delves into the thorny issues surrounding their use. For example, it is often assumed that if a set of homologous genes is assembled from different species and those data are used to infer a phylogenetic tree for those genes, then one should be able to use the gene trees as species tree, as well. Alas, there are many reasons why a gene tree may not accurately represent a species tree (see Chapter 22 for more detail). A gene tree is a model of how genes evolved through substitution, duplication, and/or loss; on the other hand, a species tree is a pattern of lineages and their relationships through time. Thus, the investigator must allow for events in the history of a gene that are not part of the history of the species, such as gene duplication, gene loss, lateral gene transfer, and recombination. Even if the gene history is the same as the species history, the history of some genes is simply difficult to infer because of factors such as convergent evolution, highly variable rates of evolution between taxa, highly biased nucleotide or amino acid composition, and small gene size.
In this section, we first describe how, in the face of these complications, species trees can be inferred from gene trees. We then discuss how, given a species tree, the occurrence of events such as gene duplications, lateral gene transfer, and convergent evolution can be inferred.
Gene Trees Can Be Used to Infer Information about Species Trees
Even though it cannot be assumed that a gene tree accurately reflects the tree of the species in which those genes reside, it is still possible to use gene trees to infer information about species history. It is important to select carefully which gene or genes will be used, because some genes have been found to be more robust indicators of species phylogeny than others. We have already seen one classical example of this: the ss-rRNA genes. As discussed in Chapters 5 and 6, phylogenetic studies of this gene revolutionized our understanding of the evolution of microorganisms. These genes are superior markers of species evolution for a variety of reasons, including the following.
-
ss-rRNA genes contain both highly conserved regions and highly variable regions, thus allowing their use in studies of both recent and ancient evolutionary events.
-
These genes are relatively easy to clone from new species or even uncultured organisms.
-
They are present in all organisms.
-
They have the same (or at least very similar) functions in all organisms.
-
They are relatively resistant to lateral gene transfer between species.
-
Sequences of these genes from more than 200,000 different organisms are now available in public databases.
Still, they are not without their faults. Potential problems due to reliance on these genes to study species evolution include the following.
-
Because ss-rRNA genes are present in multiple copies in most species, they can undergo processes such as gene conversion, unequal crossing over, and deletion (see Chapter 12), all of which complicate phylogenetic reconstructions.
-
Their sequence composition (e.g., G+C percentage) is biased by the growth temperature of the organism (see Chapter 5) in such a way that distantly related organisms that live at similar temperatures will converge on similar sequences.
-
There are some documented cases of lateral transfer of these genes.
-
Their evolutionary rate varies among taxa, thus leading to phenomena such as long branch attraction.
-
The rate of sequence change even in the more rapidly evolving regions of these genes is still very low, thus limiting their utility for studies of closely related taxa.
In summary, although ss-rRNA genes are a useful marker present in all species, they are not necessarily the ideal marker to use and probably should not be the only one used.
A wide variety of genes are commonly used to trace the evolution of species. Some are “universal” genes that are present in all taxa, including the genes that encode RNA polymerase subunits, ATPases, translation elongation factors, and various ribosomal proteins. All of these genes tend to be quite highly conserved at the sequence level and thus are not very useful when comparing closely related species. When investigating evolution within the eukaryotes, for example, less universal genes might be preferred. Studies of plant systematics frequently use the gene encoding the large subunit of rubisco (the enzyme involved in carbon fixation); likewise, studies of animal evolution often focus on the genes encoding the cytochromes.
Just as with the ss-rRNA genes, all of these alternatives have their own issues, and thus the results from their analysis will always be open to multiple interpretations. For this reason, researchers often use multiple genes. How is information from multiple genes incorporated into one analysis? One method is to build trees for each gene and then compare the trees (see, e.g., Fig. 27.26). If all of the gene trees display the same pattern, then there would be more confidence in the result. If all of the gene trees differ, the reasons for the discrepancies need to be investigated. The discrepancies could be the result of gene duplication or lateral gene transfer events.
Rather than to simply compare and contrast gene trees to each other, an alternative is to try to sum up information across multiple genes. If complete genome sequences are available, theoretically one could use every gene in a genome, and even noncoding regions. In general, there are two approaches to summing up information across many genes. The first involves concatenation in which separate alignments of different genes are combined together into a single concatenated alignment. This concatenated alignment can then be used in the same manner as any other alignment (Fig. 27.27). The advantage of this approach is that if the genes have the same history, combining them can increase the strength of phylogenetic signal, which in turn may allow some of the complications of evolution (e.g., unequal rates of change) to be overcome and a more reliable species phylogeny to be inferred.
There is a serious disadvantage to concatenation, however. Not all genes have the same history. Factors such as duplication and deletion, lateral gene transfer, hybridization, or inheritance of ancestral polymorphisms lead to gene trees differing from each other and from the species tree. When one concatenates gene sequences one thus runs a risk of producing an “average” evolutionary history that is not seen in any single gene. Thus new “phylogenomic” approaches are being developed wherein each gene is treated separately and various models of species evolution can be tested that allow for different genes to have different histories. By treating each gene separately one could answer questions like “What is the extent of lateral gene transfer?” or “When did a polyploidization event occur?” With the increased amount of genomic sequence data, it is likely that these “whole-genome” approaches to phylogenetic reconstruction will become more and more commonly used.
Gene Duplication Events Can Be Inferred from Combined Gene and Species Information
As discussed in the book, gene duplication can lead to the presence of multiple homologous copies of the gene within a species that are called paralogs because they evolve in parallel within that species. Homologs in different species that evolved from a common ancestral gene through speciation are called orthologs (Table 27.13). To represent such events on a phylogenetic tree, the gene phylogeny is embedded within a tree that shows the species phylogeny (Fig. 27.28). The phylogeny of the gene can be represented separately, as shown in Figure 27.28B.
How does a gene tree lead to an inference about gene duplication events and the determination of which genes are orthologs and which genes are paralogs? To answer this question, a species tree based on some other information must be inferred; then the gene tree is inferred; and finally the gene tree must be embedded in the species tree (as in Fig. 27.28A).
One excellent example of the use of this type of analysis is the story of globin genes. Globins are heme-containing proteins involved in binding and transporting oxygen and other small molecules found in a diverse array of animal species, including humans, who encode several different globins. Figure 27.29 shows that all of these globin genes are clearly related to each other and thus are homologs.
The various globin proteins include α, β, γ, δ, and ε hemoglobin subunits, as well as myoglobin (the oxygen-binding protein found in muscle). These proteins are all involved in oxygen and carbon dioxide transport in the blood and tissues, although each form has a slightly different function. Phylogenetic analysis of the members of the human globin gene family, along with their comparison to globin genes in other species, showed clearly that the human globins are related to each other by gene duplication events that occurred in our ancestors (Fig. 27.29). Thus, the different human globins are paralogs of each other (they have been evolving in parallel within a species after the gene duplication). Other mammals encode orthologs of many of the human globin genes. For example, chimps also encode α, β, γ, δ, and ε hemoglobin subunits as well as myoglobin. Each of these is the ortholog of the corresponding human gene (e.g., the chimp α-globin is an ortholog of the human α-globin).
Inferring gene duplication events is not just an exercise in phylogeny. It can assist us in predicting the functions of genes because orthologs frequently have the same function in different species, whereas paralogs frequently have different functions within a species. Thus, if a defect in a mouse globin gene is related to a particular murine disease, then, in order to evaluate the possible involvement of a similar defect in a human disease, it would be helpful to know whether that mouse globin was an ortholog of a human globin and, if so, which one.
Lateral Gene Transfer Events Can Be Inferred by Phylogenetic Analysis
The correspondence between gene and species lineages is disrupted when genes hop from branch to branch in phylogenetic trees through lateral gene transfer (LGT). LGT results in genes or genomic regions whose evolutionary histories differ from those of the rest of the genome. As discussed in the book, although LGT events occur with low frequency, they have had an important role in the evolution of some organisms, especially microbes, as well as in the evolution of organelles. Here, we discuss some of the ways the occurrence of LGT can be inferred, dwelling in particular on the use of phylogenetic analysis.
The ability to detect LGT often makes use of the observation that, over time, all of the genes within a genome acquire a “signature” that is characteristic of that particular genome. These distinctive genome-specific signatures include patterns of codon usage, GC content, and the DNA sequences used for promoter signals and protein-binding sites. Homologs of a gene in separate genomes diverge from each other as they evolve in different lineages, each acquiring the signature of their respective genome. Suppose that a gene is abruptly transferred from one genome to another (e.g., a gene encoding antibiotic resistance is transferred from one bacterial species to another in the human gut). For the transferred gene to persist in its new genome, it must acquire some means of being transmitted from one generation to the next (e.g., by integrating into the chromosome or by being carried on a self-replicating element such as a plasmid). The gene must also acquire the promoter signals and other features necessary for gene function within the new genome so that it can be maintained under positive selection; otherwise, the gene will likely degrade. If it is maintained in the new genome, then, in the course of time, the transferred gene will acquire the genome signature characteristic of the new host genome, a process known as amelioration (Fig. 27.30).
On the basis of these considerations, there are many ways to scan a genome or to analyze an individual gene to determine whether or not it has undergone LGT at some point in the past. These methods all look for genes whose characteristics differ from those of the “average” gene in the genome or that have anomalous phylogenetic trees. However, such methods must be used with caution because a variety of other factors can also cause regions of a genome to appear anomalous.
For example, one approach is to look for regions within a genome that have an unusual nucleotide composition compared to the rest of the genome. This screening method works well for recent LGT events if the donor and recipient genomes possess different nucleotide compositions. However, it will not detect transfers from species with similar nucleotide compositions and may mistakenly identify regions under strong selection as regions of lateral transfer. Another approach is to look for genes with highly conserved sequences that have highly sporadic distribution patterns across species. Such a sporadic distribution would be the expected result from gene transfer between distantly related taxa, but it could also be produced by gene loss from some lineages.
Phylogenetic analysis enables us to employ more discriminating criteria to identify past LGT events. Here, we can capitalize on the fact that if genes were added to a genome by LGT, phylogenetic analysis of those genes would yield trees different from those obtained for the rest of the genome. Thus, we can search for genes whose phylogenetic trees differ from those of other genes in the genome or from the species tree. This approach works best when we have an idea as to the possible source of the transferred genes and when the recipient and suspected donor genomes have markedly different phylogenies. Thus, it works relatively well to detect genes in the nuclear genome of eukaryotes that were derived from an organelle genome. Usually, however, it is more difficult to distinguish native genes from transferred genes because the gene donors are not known and/or the donor and recipient lineages are more closely related. Using this strategy to demonstrate the transfer of organellar genes to the nuclear genome entails the following steps (Fig. 27.31).
-
Build trees for all genes in the eukaryote’s genome.
-
Look for genes that branch in evolutionary trees with α-proteobacteria (and thus may be of mitochondrial origin) or cyanobacteria (plastid origin).
-
Apply tests such as bootstrapping to determine how well the gene trees represent all of the underlying data.
It is important in these cases (and, in fact, in all cases) to ask the following question: Could something other than LGT have caused the gene tree to differ from the species tree? If so, what? One possible answer is LBA. If the suspect gene experienced a higher rate of evolution than the average gene, it may be pulled toward long branches in the tree. Another possibility is that the anomalous gene is a member of a large gene family and not all of the genes in the tree are orthologs. If the tree includes a mixing of different paralogs, the tree may be topologically different from the species tree (Fig. 27.32). As a result, it is not sufficient simply to find differences between a gene tree and the species tree; the anomalous gene tree must be robust.
Phylogenetic Analysis Can Detect Recombination
Another evolutionary force that leads to different histories for different regions within a genome is recombination. Although recombination can be detected using standard population genetic approaches (e.g., following polymorphisms, generating linkage maps, and analyzing pedigrees), there are some situations where phylogenetic analysis can also play a useful role.
Consider a relatively simple case of recombination in bacteria. Suppose that two strains—strain 1 and strain 2—of bacteria differ by a variety of single-nucleotide polymorphisms (SNPs) scattered throughout their genomes. These two bacteria conjugate (see Chapter 12), and a 200-kbp section of the genome of strain 1 replaces the equivalent 200-kbp section of strain 2, thus generating strain 3. As a result, all of the genome of strain 3 is derived from strain 2, except for the 200-kbp segment from strain 1. With the passage of time and continued reproduction, all three strains diverge from each other slightly. If the entire genome of each of these strains is then sequenced, the history of the conjugational recombination event could be detected in a variety of ways. For example, phylogenetic trees could be built for all genes in the genome, including all three strains in the tree. Rooting the trees using an outgroup would show that genes in the region outside the 200-kbp recombination zone would produce a pattern with strains 2 and 3 grouped together to the exclusion of strain 1. Inside the 200-kbp region, strain 3 would group with strain 1, not with strain 2. Thus, in essence, methods very similar to those described above for detecting LGT could be used. This approach can also detect hybridization events between eukaryotic species. A simplified example of using phylogeny to detect recombination is shown in Figure 27.33.
An alternative strategy would be to compare the consistency indices for different regions of the genome. Here, first generate a baseline tree, often by using a combination of all the data. Next, align all of the genes in the genome (or align the complete genomes including even noncoding regions). Each column in the alignments is then assigned a consistency index score. Those regions of the genome that have markedly different histories due to recombination events would show up as runs of high consistency index scores.
Gene Function Can Be Predicted from Gene Trees
In the early days of gene sequencing, the choice of material to be sequenced was usually made on the basis of gene function, such as when seeking to characterize the genetic basis of a mutant phenotype or a particular protein. Today, most sequence data are generated irrespective of gene function. Granted, experimental studies are required to identify the functions of a gene conclusively; nevertheless, the prediction of gene function has become a fruitful aspect of large-scale sequencing projects. Most such predictions rely on some form of database search to identify homologs of the unknown gene (i.e., the query gene [see Box 27.1]). If a homolog is found whose function is known, then the query gene can generally be predicted to share the same function. Although this approach can work, it has limitations.
For example, in many cases, such a database search will yield dozens, hundreds, or even thousands of homologs that represent many different functions. How does one then choose which of those functions to assign to the uncharacterized query gene? Frequently, the gene whose sequence most closely matches that of the query gene is located and its function adopted. This is a straightforward approach, but it can give wrong answers due to an issue we raised previously: Rates of evolution vary between taxa and thus measures of DNA sequence similarity are not reliable measures of evolutionary relatedness. To illustrate this possibility, look at gene α in species 3 in Figure 27.34. This gene is a member of a gene family with two paralogous subfamilies, α and β, derived from a duplication that occurred in the last common ancestor of all three species. Suppose further that, as commonly occurs, α and β diverged in function such that all three α genes (which are orthologs of each other) have the “blue” function and all three orthologs of β have the “red” function. If species 3 had a slower rate of evolution than other species in the tree (as shown in Fig. 27.34) and a database search was performed using gene α from species 3 as the query gene, then gene β from species 3 would be identified as the best match, even though it is a paralog of α and has a different function.
These difficulties can be overcome by using phylogenetic reconstructions to assist with the functional predictions as detailed in Figure 27.34. Ancestral states along the tree can be inferred as well as a possible state for any uncharacterized genes in the tree. Either parsimony character state reconstruction methods or likelihood approaches can be used, and the results have generally provided more accurate predictions of gene function than those based on simple database searches. This approach is known as phylogenomics, so named because it integrates evolutionary analysis with genome sequence analysis. With these tools, we can infer relatedness, rather than having to rely on similarity.
Correlated Substitutions Can Be Used to Solve RNA Structures
rRNA molecules form complicated secondary structures, often with the molecule folding back on itself to form stem sections that are regions of a double-stranded helix stabilized by intramolecular base pairing. The techniques most often used to resolve macromolecular structures, such as crystallography and nuclear magnetic resonance (NMR), encounter difficulties when used to analyze rRNA structures. This limitation can be circumvented for the most part by using the process of evolutionary analysis outlined in the following steps to generate models for the secondary structure of RNAs (see also Aim and Scope and p. 545).
-
Collect sequences of RNAs that are thought to form the same or similar structures. Ideally, select sequences with sufficient relatedness so that they can be aligned at the primary sequence level.
-
Generate a multiple sequence alignment of the RNA sequences.
-
Build a phylogenetic tree of the RNAs.
-
Using a character state reconstruction method, infer when particular changes occurred and map them onto the branches on this tree.
-
Look for branches for which multiple alignment columns have undergone changes, i.e., molecular regions where several sequence positions have been altered.
-
Search within those regions for cases where the same two columns changed in multiple branches more frequently than one would predict based on chance alone. These correlated changes suggest a possible interaction between the columns in each pair. One such interaction that would have significant impact on the secondary structure would be hydrogen bonding between those nucleotides so as to stabilize a local double-stranded stem structure.
-
Build a model of the secondary structure that takes those pairs of interacting alignment columns into account, such that the maximum number of those pairs are joined by hydrogen bonds.
Relative Rate Test and Molecular Clocks
As discussed above, the rate of evolution is not uniform in different lineages (e.g., see pp. 531–533). A simple metric known as the relative rate test can demonstrate this. Consider a tree of three species (Fig. 27.35) where the branch lengths represent the amount of divergence (this could be based on a parsimony, likelihood, or distance calculation). Suppose one wanted to know whether the rate of evolution was uniform in the lineages of species 2 and species 1 because they shared a common ancestor (node O) (i.e., if dO1 = dO2). Because one usually does not have data on ancestral nodes, answering this question might seem challenging. However, species 3 can be used as the test bed for this in the following manner:
d13 = dO1 + dOR + dR3, |
(6) |
d23 = dO2 + dOR + dR3. |
(7) |
These can be rearranged to
dO1 = dOR + dR3 – d13, |
(8) |
dO2 = dOR + dR3 – d23. |
(9) |
If dO1 = dO2, then dO1 – dO2 should equal 0.
One can then combine Equations 8 and 9:
dO1 – dO2 = dOR + dR3 – d13 – (dOR + dR3 – d23),
dO1 – dO2 = d23 – d13.
Thus, if dO1 = dO2, then d23 must equal d13. Because we can measure d13 and d23, we can now test for whether dO1 = dO2.
By doing this type of relative rate test, we can determine whether evolutionary rates varied for a particular dataset. If the rates have been relatively uniform, then the rates are treated as a “clock” to estimate dates of divergences on a tree. When using molecular data, this is known as a “molecular clock.”
A key aspect of using a molecular clock is that the rates of change can be calculated from a tree. Consider the tree shown in Figure 27.35. We can label the occurrence of the two ancestral nodes O and R as t and T, respectively. Suppose we know t. Can we use this to calculate T? If the rates of change are uniform (as could be indicated by a relative rate test), a very simple calculation can be performed to estimate T.
First, we need a factor (x) for converting d to time, which is generated by making use of t and D12. D12 × x = 2t (the factor of two comes from the two branches each representing t units of time). From this, we can calculate x. x = 2t/D12 (we know t and D12). Then we can use this x to estimate T:
D13 × x = 2T,
T = D13 × x × 0.5.
Of course, in reality, making estimates of divergence using a molecular clock are not this straightforward. First, rates of evolution are rarely if ever completely uniform. Second, measures of dates for particular nodes usually have some amount of error associated with them. Third, most ancestral nodes for which there are dates are actually on offshoot branches from a tree, rather than specific ancestral nodes. Thus, multiple calibration points must be used, and the relationship is plotted between some measure of distance and different date estimates. If this relationship for multiple calibration points is relatively uniform, then one can use the relationship to create a formula for converting d to t that is more realistic than the simple system outlined above.
Phylogenetic Contrasts Can Correct for Shared History Bias
The benefit of using phylogeny in solving the rRNA structure is that it allows correlations across sites within the molecule to be identified more carefully. When one simply looks at a multiple sequence alignment without using any information on phylogeny, many true correlations are missed and many false ones are found. The inaccurate identification of correlations in the underlying data occurs because each sequence is not independent of the other sequences. They are related to each other by a history. Those sequences that are closely related share certain patterns (such as particular nucleotides in the rRNA alignment) due to their shared history. If this shared history is ignored, the correlations involving these sequences will be overcounted. The concept here is similar to that of the relative rate test described above. The distance between species 1 and 3 is not independent of that between 2 and 3 because some of the distance is on the same branch connecting O and 3.
This turns out to be a general problem in comparative biology. Correlations can be identified across multiple taxa or traits, but if the underlying phylogenetic tree is not accounted for, some true correlations will be missed and some spurious correlations will arise (see Fig. 27.36).
It is possible to correct for this bias by removing the correlation that is due to shared history of organisms and examining the residual correlation. The general method for doing this is phylogenetic contrasts. To carry out this method, two key pieces of information are needed: character traits for a set of OTUs (e.g., species or genes) and a phylogenetic tree showing the relationships among these OTUs with branch lengths. This information is then used to calculate “contrasts,” which are measures of the differences in the traits between the two OTUs in the tree. These contrasts are a way of calculating changes in traits along branches, which in turn can be used to examine how when one trait changes, other traits change. Figure 27.36 provides more detail on this method.
Summary
This chapter has discussed how phylogenetic trees are inferred emphasizing molecular sequence data as a model system. Methods for phylogenetic reconstruction, as well as how to evaluate the methods and also various uses of the trees they generate, were described. Molecular sequences were chosen as a model system because trees based on sequence data are becoming ever more common and ever more powerful. However, trees based on other character traits are also useful. The same methods and issues that have been described in this chapter apply to trees based on morphology, behavior, or any other trait.
Further Reading
Avise J.C. 2000. Phylogeny: The history and formation of species. Harvard University Press, Cambridge, Massachusetts.
Felsenstein J. 2004. Inferring phylogenies. Sinauer Associates, Sunderland, Massachusetts.
Hillis D.M., Moritz C., and Mable B.K., eds. 1996. Molecular systematics, 2nd ed. Sinauer Associates, Sunderland, Massachusetts.
Page R.D.M. and Holmes E.C. 1998. Molecular evolution: A phylogenetic approach. Blackwell Science, Oxford.
|


