|
Problem 19.1
A large outbred population of Drosophila melanogaster is polymorphic at a gene coding for a metabolic enzyme. There are two alleles (Q, P) at equal frequencies (q = p = 1/2). To determine whether this polymorphism is maintained by balancing selection, ten replicate cages are established, each with 100 PQ individuals, and 400 QQ individuals, taken from the base population. These are then propagated under the same conditions as the base population. The aim is to determine whether the allele frequency increases consistently, as expected if it is maintained at an equilibrium of 50% by balancing selection.
After 20 generations, samples of 200 flies are taken from each cage. The frequency of the P allele is {0.185, 0.17, 0.1825, 0.235, 0.305, 0.185, 0.1625, 0.1775, 0.155, 0.23}.
|
| *i) |
Does the average frequency differ significantly from the initial frequency? HINT 19A
|
| **ii) |
Estimate the strength of selection. HINT 19B
|
| **iii) |
Roughly, what is the smallest selection coefficient detectable in an experiment of this design?
|
| **iv) |
Is the variance in allele frequency between cages greater than expected from sampling error? HINT 19C Assuming that any excess variance among demes is due to random drift, estimate the effective population size of each cage. HINT 19D
|
| **v) |
How could you tell whether the change in allele frequency is due to the enzyme allele itself, rather than a closely linked allele?
|
|
Problem 19.2
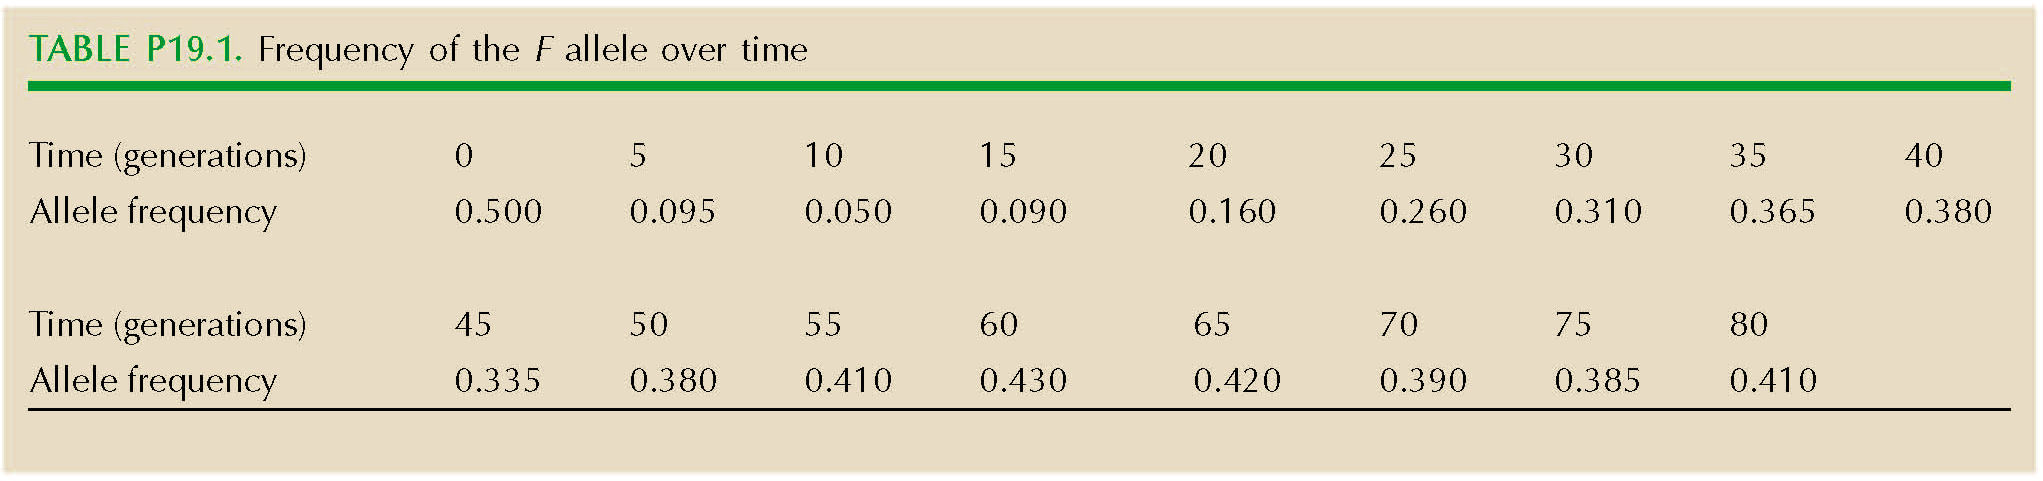
A study aims to measure the selection on the F allele of alcohol dehydrogenase in D. melanogaster, which is polymorphic in natural populations. A cage is set up, initially containing F1 individuals from a cross between inbred lines that are fixed for S and fixed for F. The cage is maintained under constant conditions and at a large population size for 80 generations. Samples of 100 flies are taken every five generations. The frequency of the F allele in these samples is shown in Figure P19.1 and Table P19.1.
|
| **i) |
How can you explain this pattern? HINT 19E
|
| **ii) |
How could you improve the design of the experiment?
|
|
Problem 19.3
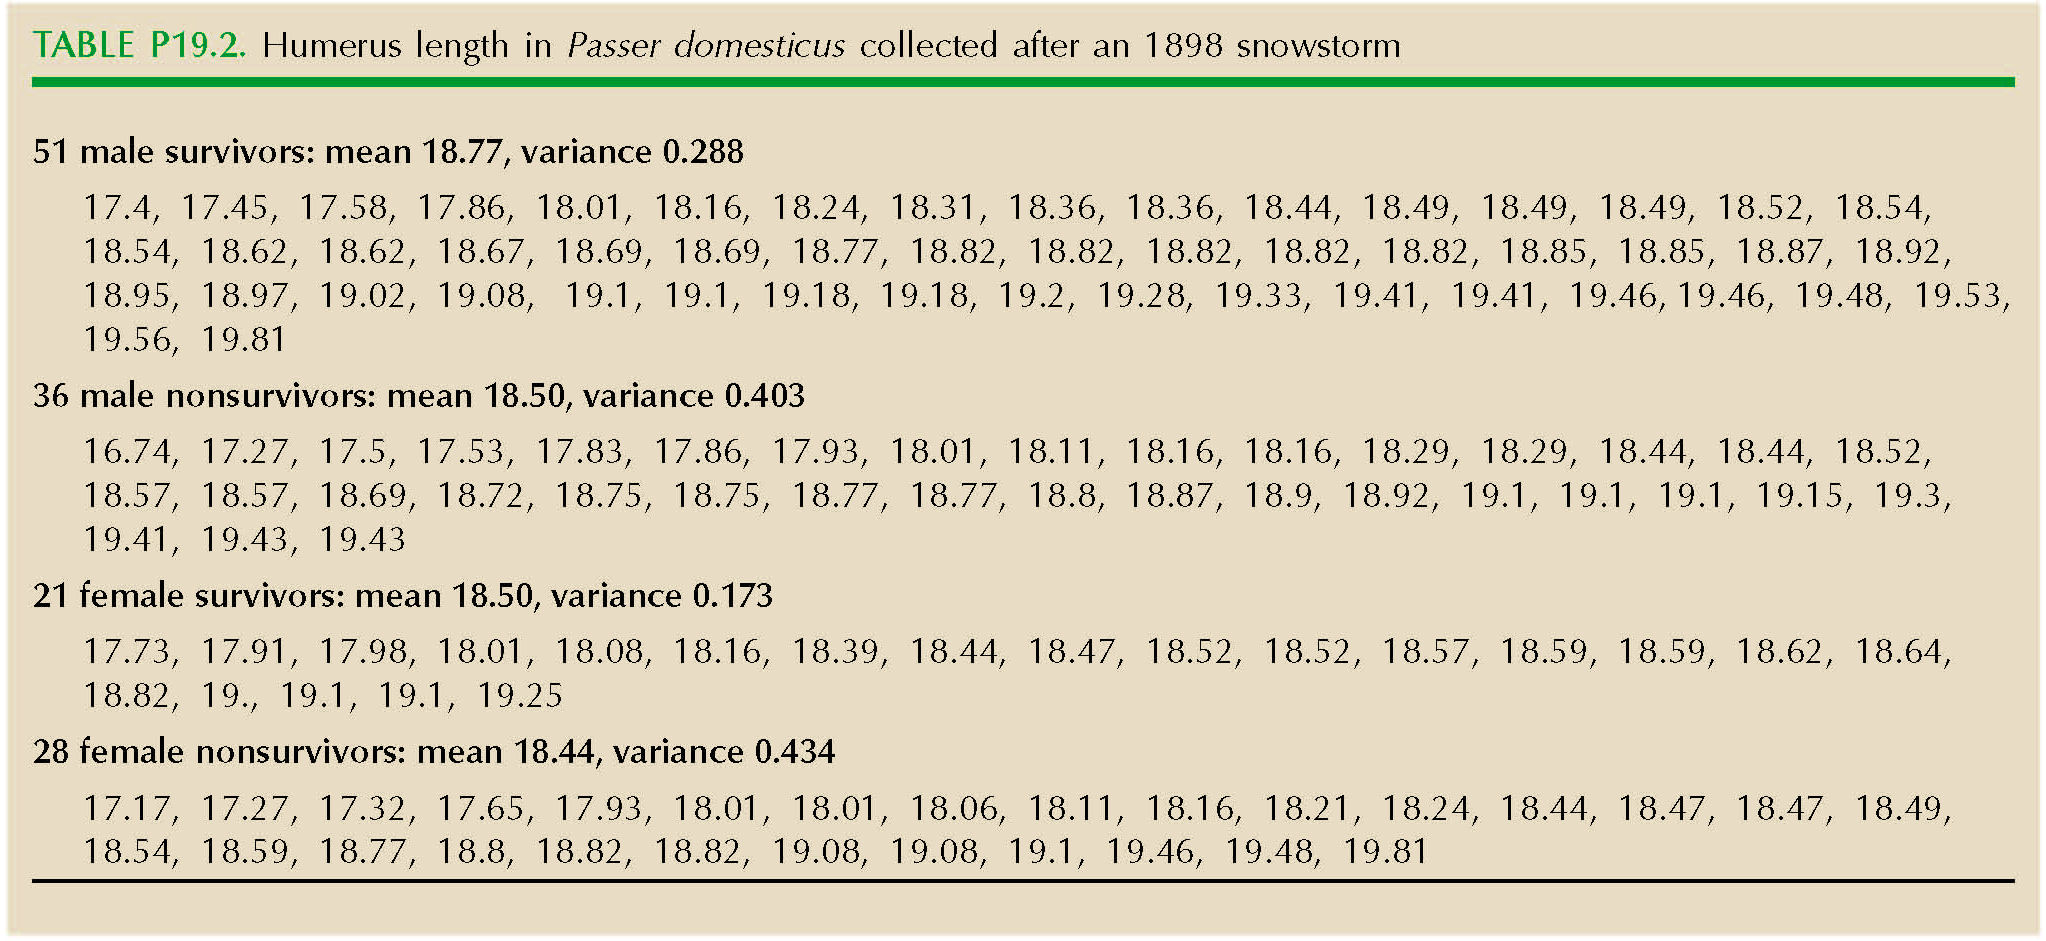
On February 1, 1898, New England suffered a severe snowstorm. In a classic study of natural selection, Hermon Bumpus collected 136 sparrows (Passer domesticus) that had been grounded by the storm; 72 of these survived, and the rest died. Bumpus measured nine morphological traits. Table P19.2 shows data for humerus length (in millimeters) in males and females.
|
| *i) |
Draw histograms comparing the trait in survivors and nonsurvivors. What kind of selection is acting on each sex?
|
| **ii) |
What would be the long-term consequences of this selection? (A qualitative answer will be enough.) NOTE 19B
|
|
Problem 19.4
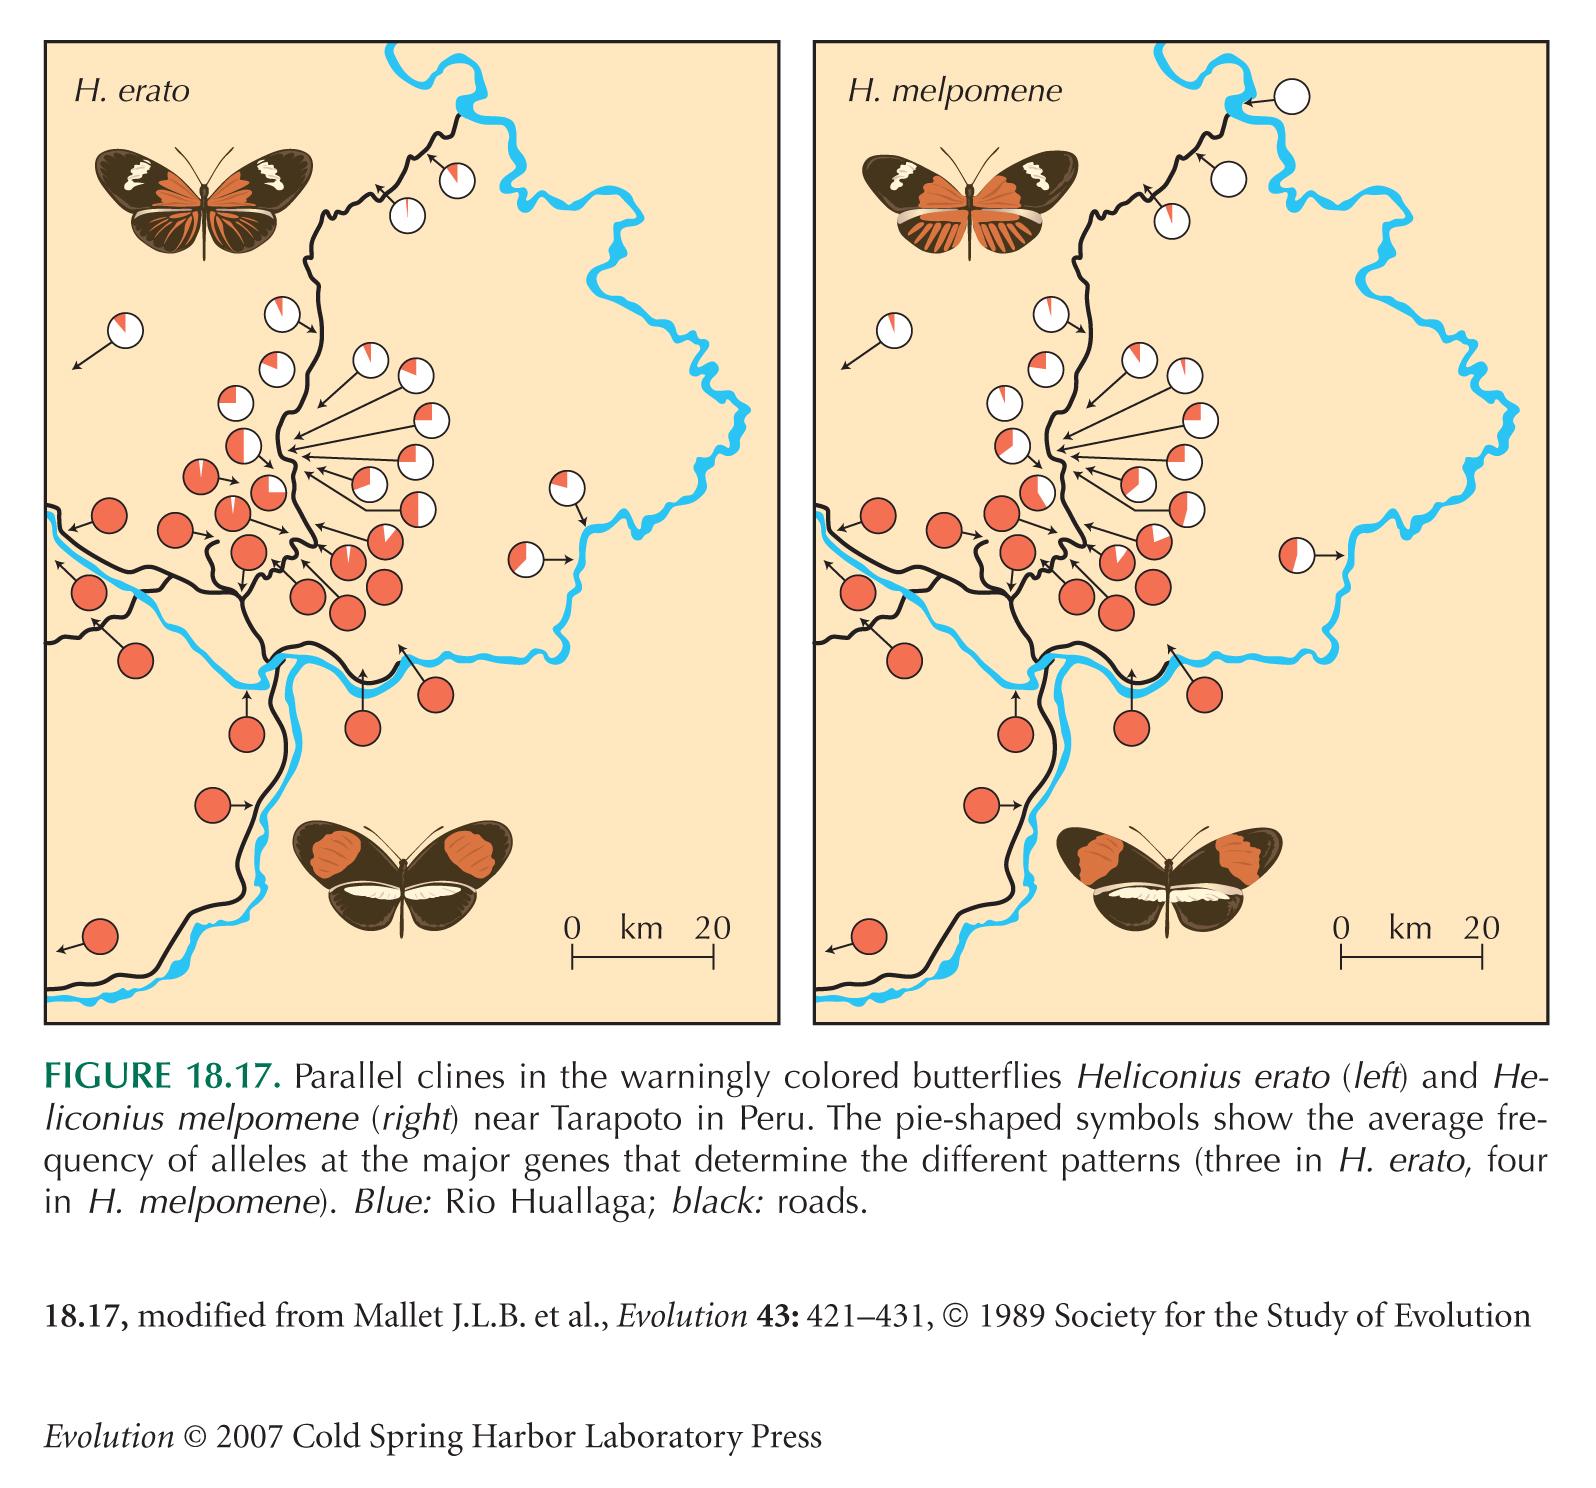
The butterfly Heliconius erato carries a conspicuous color pattern, which advertises its distastefulness to birds. Two distinct patterns meet near Tarapoto, in Peru (see Fig. 18.17). They remain separated by a set of narrow clines, which are maintained by selection that favors whichever pattern is most common in an area (see pp. 475–476). In effect, rare alleles are at a disadvantage, because they tend to be found in butterflies with unusual patterns, which are not recognized by birds as being distasteful, and so are eaten.
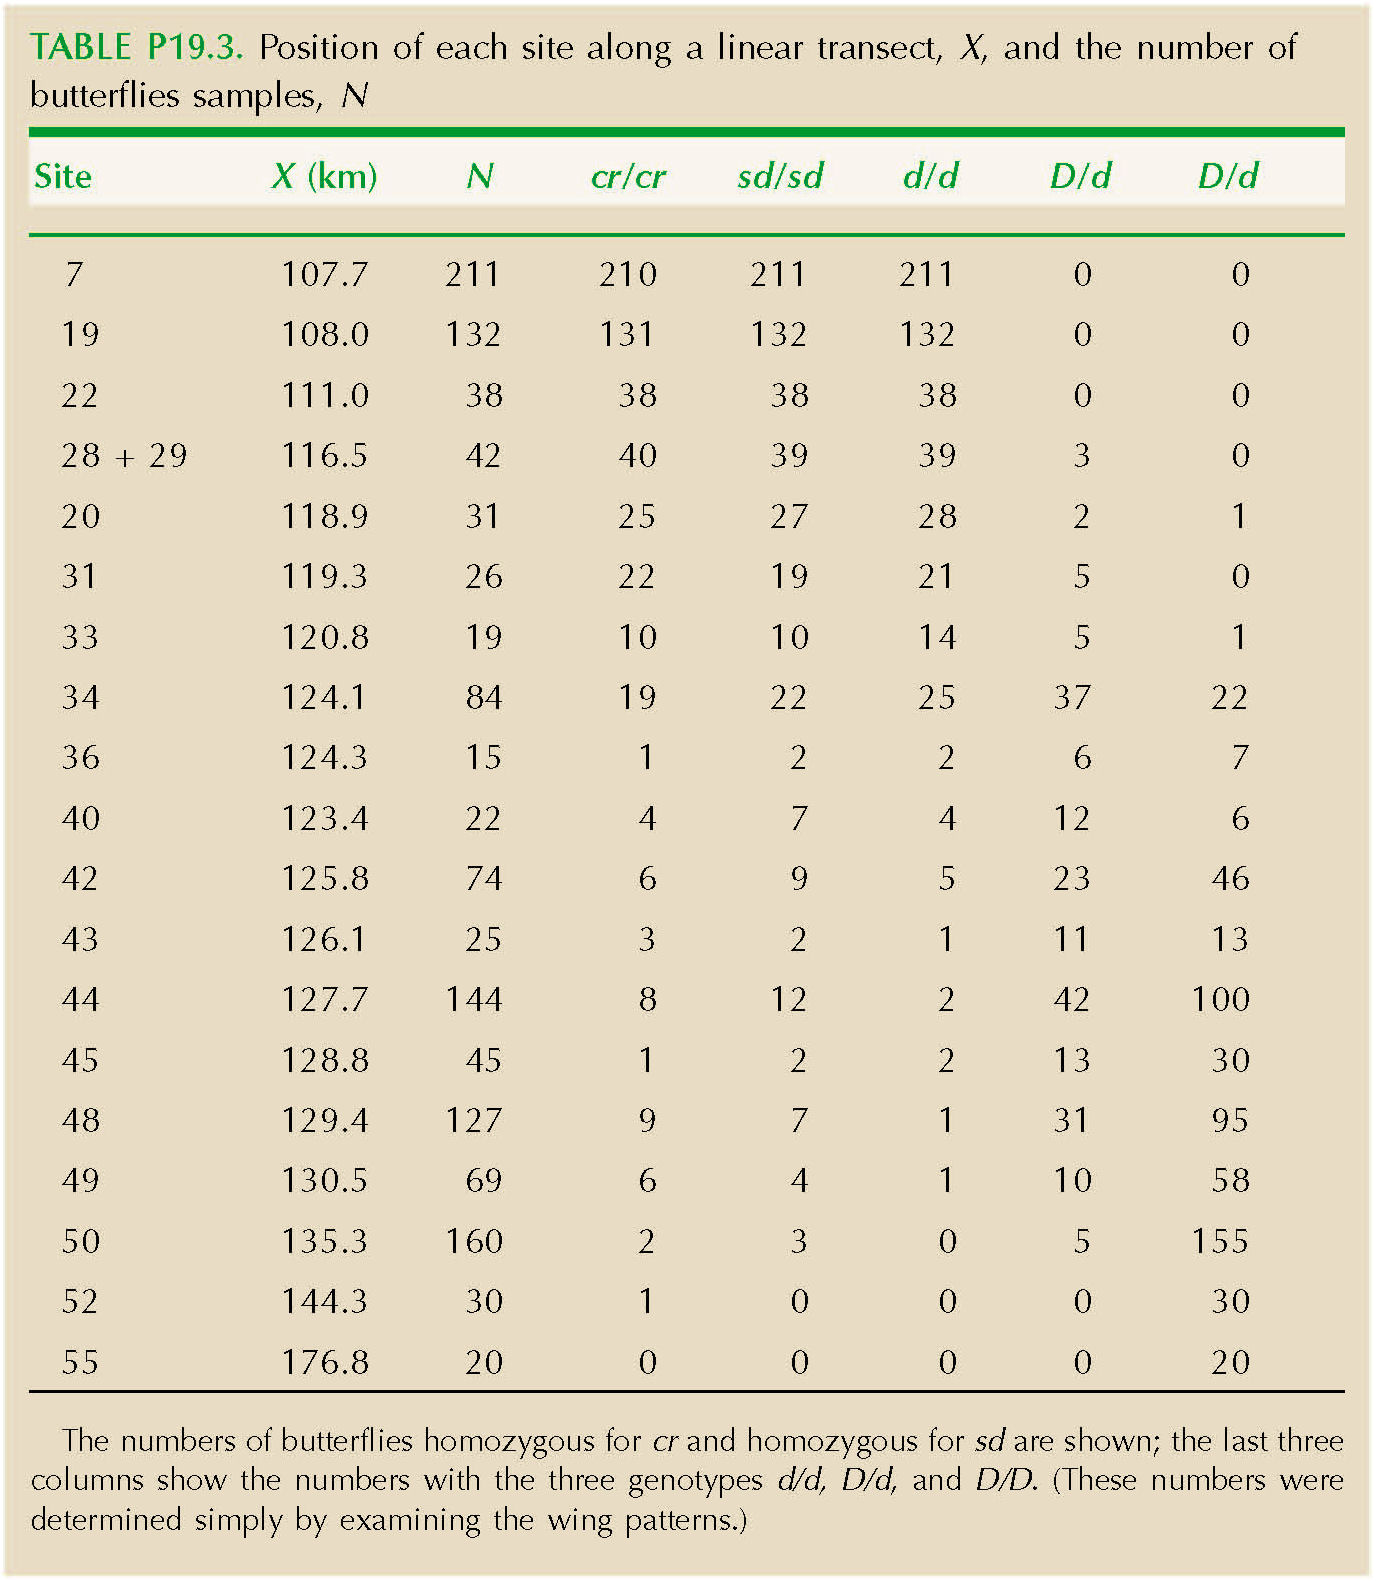
The differences between the two patterns are mainly determined by three unlinked autosomal genes. The alleles d, D determine the pattern of rays on the hindwing; heterozygotes can be distinguished from both homozygotes. The alleles cr, Cr determine the size of the hindwing bar, and sd, Sd determine the size of the forewing bar. Cr is dominant over cr, and Sd over sd (Fig. P19.2).
Table P19.3 shows the position of each site along a linear transect, X, and the number of butterflies sampled, N. The numbers of butterflies homozygous for cr and homozygous for sd are shown; the last three columns show the numbers with the three genotypes d/d, D/d and D/D. (These numbers were determined simply by examining the wing patterns.)
|
| *i) |
Plot the frequencies of alleles cr, sd, and d against distance. HINT 19F
|
| *ii) |
How wide are the clines in allele frequency at these three loci? (It is convenient to define cline width as the inverse of the maximum gradient in allele frequency (see Fig. P19.3).
|
| **iii) |
The rate of gene flow in this species was estimated as σ2 ~ 2.8 km2 per generation, a standard deviation of σ ~ 1.7 km (see Problem 16.9). Estimate the strength of selection acting to maintain the clines at each of the three loci. (You can assume that if s is the strength of selection against an allele when it is rare, then the cline width is given by the same formula as for selection s against heterozygotes.) HINT 19G NOTE 19C
|
|
Problem 19.5
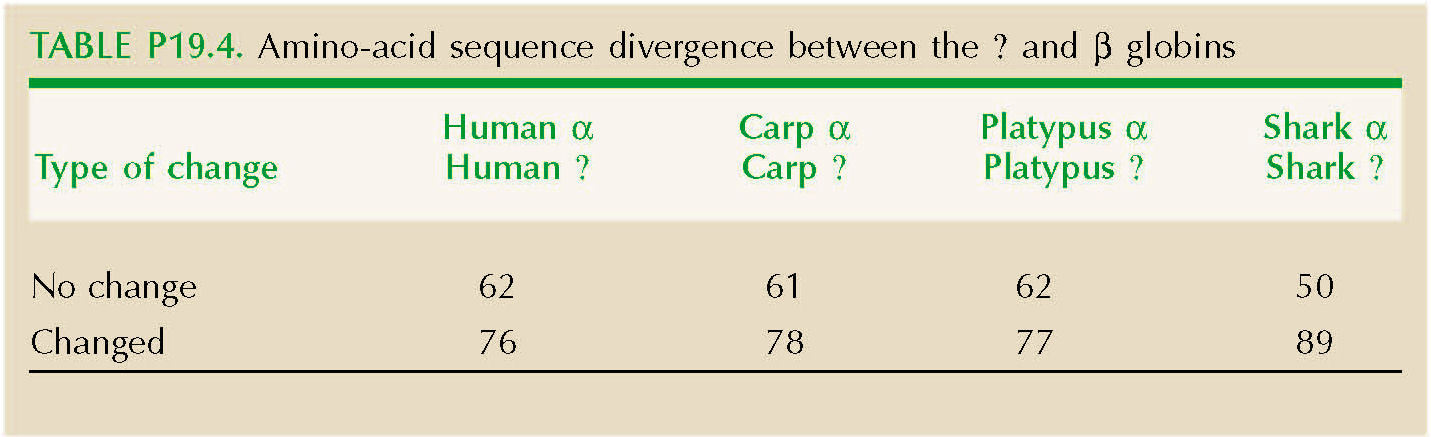
The α and β globins diverged following a gene duplication event about 500 million years ago (Mya), near the origin of the vertebrates. Table P19.4 shows four comparisons between α and β globins, involving different pairs of species that have had largely independent evolutionary histories. For each pair, the sequences of the two proteins are aligned, and sites are classified according to whether they have the same, or a different, amino acid. NOTE 19D
|
| *i) |
What is the most striking feature of these data?
|
| *ii) |
The simplest model for these data is that each site experiences an amino acid substitution at some constant rate λ per year. What is the chance that the site will not have changed during the divergence of the α and β globins? HINT 19H
|
| *iii) |
Use this result to estimate the rate of divergence, λ, and the expected total number of substitutions that have occurred across the whole gene. HINT 19I
|
| *iv) |
Estimate the number of changes that involved a single-amino-acid substitution and the number that involved two or more substitutions. HINT 19J
|
| ***v) |
How could you find whether one or many substitutions had in fact occurred? HINT 19K NOTE 19E
|
|
Problem 19.6
Figure 19.11 gives the number of amino acid differences between the β globins of each pair of six mammalian species. The total length of the protein is 146 amino acids. In this problem, we investigate whether these proteins differ more than we would expect under the simplest model of molecular evolution. We assume that these mammals all diverged at about the same time, so that their phylogeny is a star. To make the analysis, we have to make two corrections: First, to allow for multiple substitutions, and second, to find how the observed distribution of differences between two species is related to the underlying distribution of the number of changes along each lineage.
|
| **i) |
Use the same method as that in the previous question to estimate the total number of substitutions that has occurred during the divergence of each pair of species. HINT 19L Work with these estimates in the rest of the question.
|
| **ii) |
Write the number of substitutions that separate each of the six species from their common ancestor as x1, x2, ..., x6. Then, the difference between species i and j is just dij = xi + xj. We have estimated the 15 dij and now need to relate their mean and variance to the mean and variance of the underlying xi. It is easy to see that the mean of dij is twice the mean of the xi. The variance of the dij is equal to 2(n – 2)/n times the variance of the xi, where n = 6 is the number of species. Use these formulae to estimate the ratio of the variance to the mean.
|
| **iii) |
The variance in the number of substitutions is expected to equal the mean if the distribution of this number is Poisson, as predicted by the simple neutral theory. What might explain the excess variance observed here? NOTE 19F
|
|
Problem 19.7
The neutral theory can be tested by comparison with the distribution of allele frequencies within populations. One of the first tests of this kind was devised by Ewens and Watterson (see p. 534, and ).
Suppose that we see k alleles in a sample of n genes. The numbers of each allele are {n1, n2, ..., nk). Under the neutral theory, the chance of seeing this configuration is
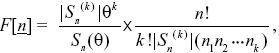
where Sn(θ) ≡ θ(θ + 1) ··· (θ + n – 1), |Sn(k)| is the coefficient of θk in Sn (θ), and θ = 4 Neμ.
This formula has two terms. The first gives the probability of seeing k alleles, and depends on the parameter θ = 4Neμ. (For example, with n = 4 genes, S4(θ) = θ(θ + 1)(θ + 2)(θ + 3) = 6θ + 11θ2 + 6θ3 + θ4. The probability of there being 1, 2, 3, 4 alleles in the sample is just proportional to the four terms in this series.) The second term is the probability of seeing the numbers {n1, n2, ...}, given that we have seen k alleles in a sample of n. (For example, with four genes, the chance of seeing two alleles in numbers {3,1} is 4!/2! × 11 × (3 × 1) = 4/11. This does not depend on θ, and so can be used to test whether the numbers we see are likely if the neutral theory is correct.
In a sample of 12 genes, four alleles are found. There are n1 = 8 copies of the first, n2 = 2 of another, and n3 = n4 = 1 of the third and fourth.
|
| *i) |
Estimate the proportion of homozygotes in the population, assuming random mating.
|
| **ii) |
Draw a graph of the probability of seeing k = 4 alleles, plotted against θ.
|
| *iii) |
What is the most likely value of θ? What homozygosity would you expect from this value of θ?
|
| **iv) |
Given that there are four alleles, does the sample indicate significantly more homozygosity than predicted by neutrality? HINT 19M HINT 19N
|
|
Problem 19.8
This question looks at some data used to estimate the fraction of amino acid substitutions that were established by positive selection (see Box 19.1). Table P19.5 shows data for 25 genes, from Drosophila simulans and Drosophila yakuba. These two species shared a common ancestor about 6 Mya. Each row shows the gene; the number of nucleotides in the coding sequence; the divergence between D. simulans and D. yakuba, corrected for multiple substitutions, for nonsynonymous (Dn) and synonymous (Ds) changes; and the number of polymorphic sites within D. simulans, again classified into nonsynonymous (Pn) and synonymous (Ps) polymorphisms. NOTE 19G
|
| *i) |
What is the average ratio of nonsynonymous polymorphisms to synonymous polymorphisms? Use this to estimate the amount of nonsynonymous divergence, Dn*, expected under the neutral theory.
|
| **ii) |
Estimate the fraction of amino acid substitutions that have been established by selection. HINT 19O
|
| ***iii) |
What factors, other than positive selection for amino acid divergence, might cause the proportions of nonsynonymous to synonymous divergence and polymorphism to deviate from the expectation under the neutral theory? What are the strengths of this test?
|
|
Problem 19.9
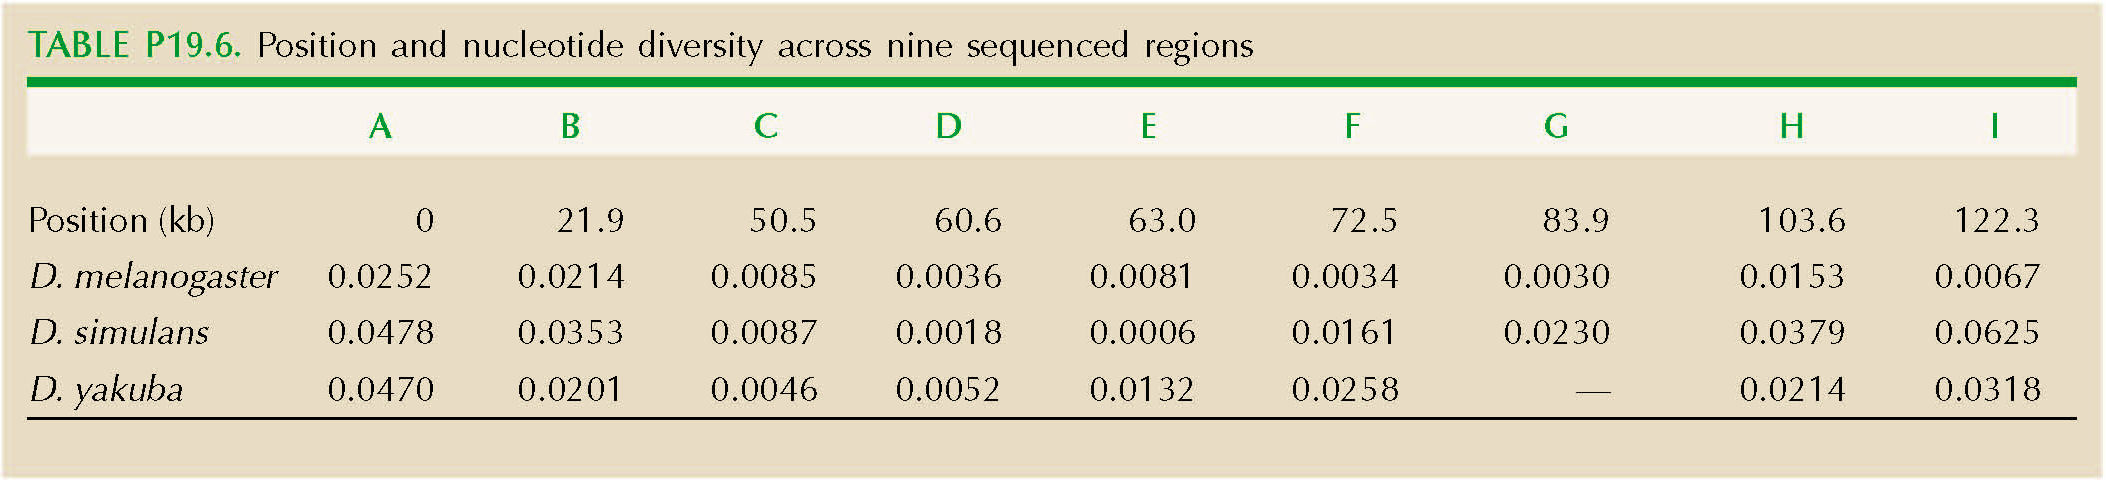
The region around a gene has lower genetic diversity in three Drosophila species: D. melanogaster, D. yakuba, and D. simulans. This reduction is thought to be due to recent selective sweeps; this is a rapidly evolving gene that is involved in the defense against viruses. This problem shows how we can estimate the strength of selection on favorable alleles.
|
| *i) |
Table P19.6 shows the position of each of the nine sequenced regions (A–I), and their nucleotide diversity at synonymous sites (πs), in the three species. Draw a graph that shows how πs varies across this region. Over roughly what distance is diversity reduced?
|
| *ii) |
If a favorable allele starts as a single copy, in a population of N diploid individuals, and has selective advantage s, how long will it take to reach high frequency (p = 0.5, say)? HINT 19P
|
| **iii) |
At a site that recombines at a rate c with the selected locus, what is the chance that no recombination will have occurred during the time that it took for the allele to rise to high frequency? HINT 19Q
|
| **iv) |
What is the expected nucleotide diversity, π, at a site linked to the selected locus? Sketch a graph of the expected diversity as a function of recombination rate, c. HINT 19R
|
| **v) |
Estimate the selection coefficient that best fits the data. HINT 19S Assume a population size of N = 106 and a recombination rate 1.5 × 10⁻⁸ per base pair. NOTE 19H
|
|
Problem 19.10
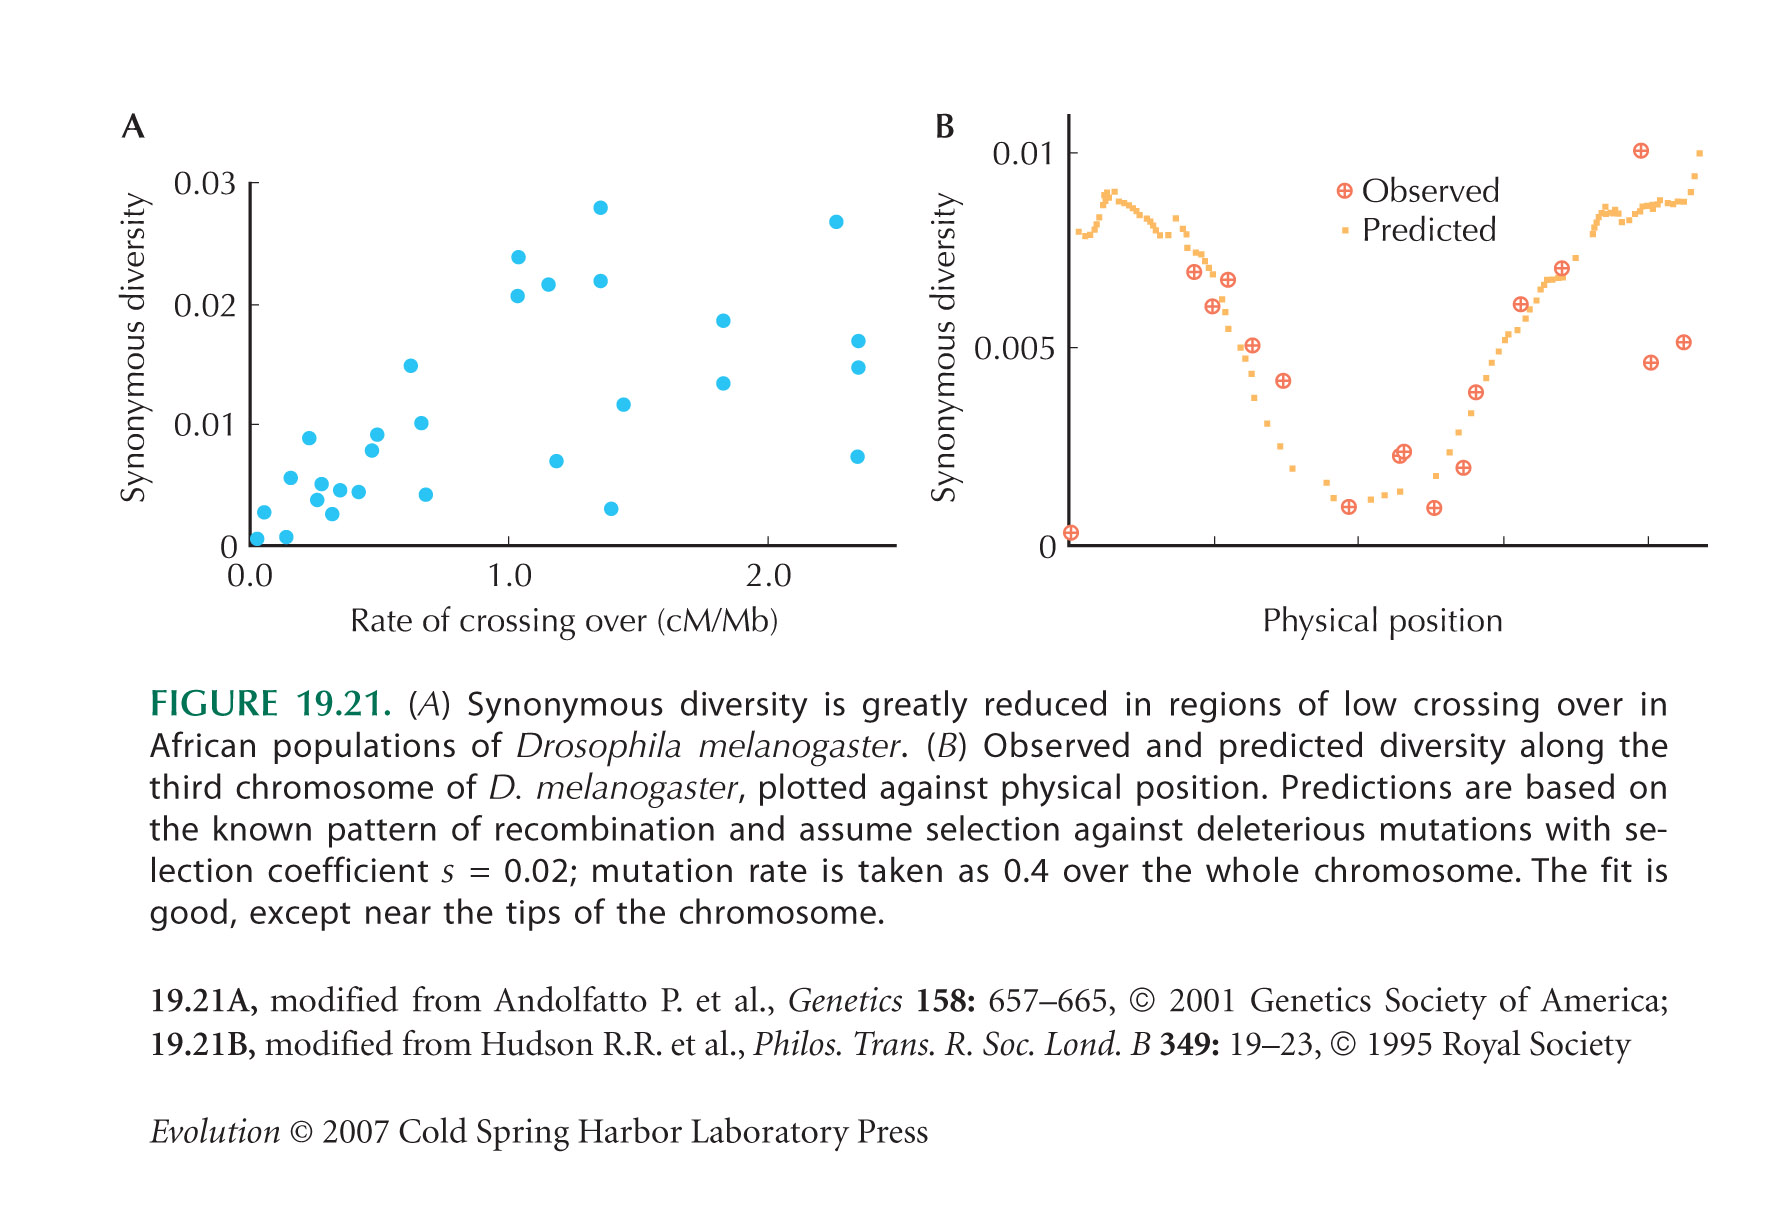
Figure 19.21A shows that the synonymous diversity is lower in regions of the D. melanogaster genome that have lower rates of recombination per base pair. Background selection is predicted to reduce neutral diversity by exp(–U/R), where U is the total rate of deleterious mutation per diploid genome and R is the total rate of recombination. (See Web Notes.)
|
| **i) |
If the reduced diversity seen in Figure 19.21A is due to background selection, what rate of deleterious mutation per base pair is required?
|
| **ii) |
Is this rate plausible? HINT 19T
|
|
Problem 19.11
Balancing selection has maintained a stable polymorphism for a very long time, with two alleles at frequencies 0.3:0.7. Over the genome as a whole, nucleotide diversity at synonymous sites averages π = 0.02.
|
| **i) |
What is the nucleotide diversity at a site very tightly linked to the balanced polymorphism? HINT 19U
|
| **ii) |
Now, suppose that the more common allele in the balanced polymorphism arose 105 generations ago from a single mutation, the mutation rate per site is 5 × 10⁻⁹ per generation. What is the nucleotide diversity now? HINT 19V
|
|
Problem 19.12
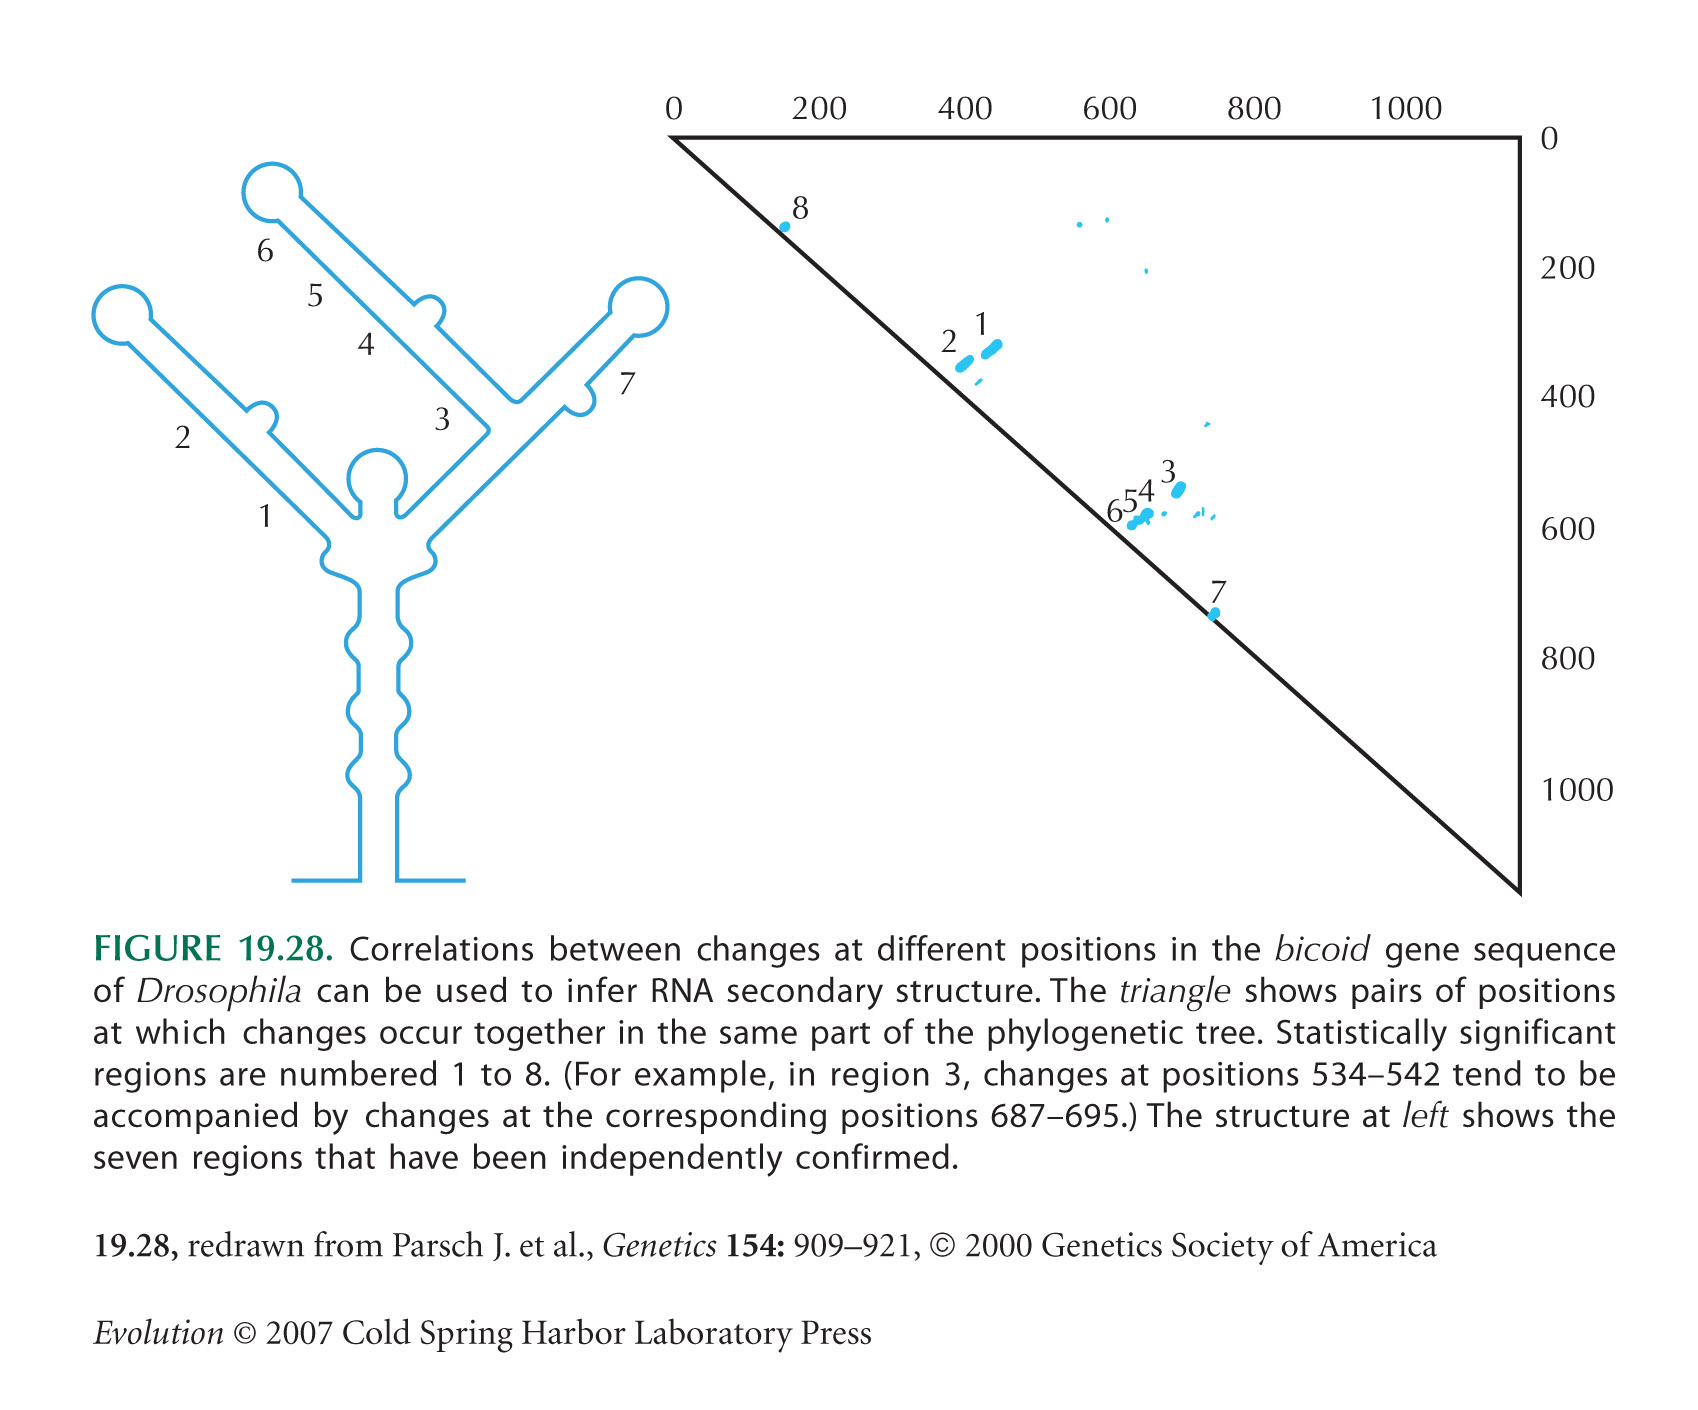
This question shows how selection to maintain pairing in RNA structures slows down the rate of molecular evolution at the sites involved. Figure 19.28 shows the secondary structure of the bicoid mRNA that is required for this molecule to be correctly localized in the developing egg. This structure is maintained by pairing between complementary bases; a total of 71 bp, or 142 nucleotides, are involved. Nevertheless, paired regions do evolve: Typically, a change at one site is followed by a change at the complementary site, so that pairing is maintained. NOTE 19I The estimated rate of substitution per nucleotide site in these paired regions is estimated to be one-fifth that in adjacent unpaired regions.
Assume that the mutation rate per site per generation, μ, is low relative to the rate of random drift (Neμ << 1), so that each species is usually fixed: Polymorphism can be neglected.
|
| *i) |
Suppose that a mispaired site causes a slight reduction in relative fitness, s. What is the probability that a single new mutation that disrupts pairing will fix in the population? HINT 19W Multiply by the number of mutations produced every generation to find the rate of substitution of mutations that disrupt pairing, at any one of the 71 pairs.
|
| **ii) |
What strength of selection (Nes) is needed to explain the reduction in rate of molecular evolution that is caused by selection to maintain pairing? HINT 19X
|
| **iii) |
Once a deleterious mutation has fixed, any mutation that restores pairing will be at a selective advantage, s. What is the rate of substitutions that restore pairing? HINT 19Y
|
| ***iv) |
Given this estimate, what fraction of sites in the regions that should be paired do you expect to be mispaired at equilibrium? NOTE 19J
|
|
Problem 19.13
Suppose that 1000 polymorphisms are maintained by heterozygote advantage: At each locus, there are two alleles, and heterozygotes have a fitness advantage s = 1% over both homozygotes.
|
| *i) |
Assuming that fitnesses multiply together, what is the fitness of an entirely heterozygous individual, relative to an entirely homozygous individual? What is the fitness of an average individual, relative to the maximum possible?
|
| *ii) |
What are the mean and variance of the number of heterozygous loci in an individual? HINT 19Z
|
| *iii) |
What is the range of fitnesses likely to be shown by the most and the least heterozygous individuals in a population?
|
|
Problem 19.14 *C28*
After a sudden change in environment, a rare allele P becomes favored: The fitnesses of genotypes QQ, PQ and PP are 1– 2s:1 – s:1, respectively. The frequency of P increases from a low value p0 to fixation, but although it does so, the population is less fit than it might be.
|
| *i) |
What is the loss in mean fitness per generation, as a result of the presence of the less fit allele, Q?
|
| ***ii) |
Find the total loss of mean fitness over the whole timecourse to fixation, by integrating the loss per generation. HINT 19AA
|
| **iii) |
What would the total loss of mean fitness be for a dominant allele (fitnesses 1 – s:1:1)? HINT 19BB
|
|
Problem 19.15 *C28*
Two neutral alleles (AU, AV) at locus A segregate at frequencies u, v (u + v = 1); initially, u0 = 0.2. A new mutation, BP, which increases relative fitness by s = 1%, occurs at a linked locus, B, and increases at the expense of the original allele, BQ. The population size is N = 107 diploid individuals. The rate of recombination between A and B is c = 0.1%. The new mutation happens to arise on a genome that carried AU, and, initially, there is a complete association between AU and BP. This problem shows how we can find the overall increase in AU that is caused by the substitution of BP for BQ. NOTE 19K
|
| **i) |
What is the rate of increase in frequency of BP? HINT 19CC What is the allele frequency, p, after t generations? HINT 19DD
|
| *ii) |
Within genomes that carry allele BP, the frequency of AU alleles is uP. Similarly, the frequency of AU alleles within genomes carrying BQ is uQ. Thus, the overall frequency of AU is u = puP + quQ. What are uP, uQ in the first generation?
|
| **iii) |
How fast does AU increase as a result of its association with BP? HINT 19EE
|
| ***iv) |
How does the association between AU and BP, as measured by uP – uQ, change? HINT 19FF What is this association after t generations?
|
| ***v) |
Write down a differential equation for the change in u through time. HINT 19GG What is the overall change in u, as BP increases from one copy toward fixation? HINT 19HH
|
| **vi) |
What is the probability that BP occurs with AV rather than with AU? What is the change in frequency of AU if it does? Use this result to find the overall mean and variance of the change in frequency of AU caused by a random substitution at B.
|
| ***vii) |
If favorable mutations with advantage s substitute at a rate Λ = 0.05 per genome per generation, in a genome of total map length R = 5, what is the overall increase in variance of allele frequency at a neutral locus? If the effective population size, Ne, is defined by setting the rate of increase in variance of neutral alleles to uv/(2Ne), then what is Ne? HINT 19II NOTE 19L
|
Bumpus H.C. 1899. The elimination of the unfit as illustrated by the introduced sparrow, Passer domesticus. Biol. Lectures, Marine Biol. Lab, Woods Hole: 209–226.
Johnston R.F., Niles D.M., and Rohwer S.A. 1972. Herman Bumpus and natural selection in the house sparrow Passer domesticus. Evolution 26: 20–31.
Kimura M. 1983. The neutral theory of molecular evolution. Cambridge University Press, Cambridge.
O’Donald P. 1973. A further analysis of Bumpus’ data: The intensity of natural selection. Evolution 27: 398–404.
Schluter D. 1988. Estimating the form of natural selection on a quantitative trait. Evolution 42: 849–861.


